SBMJuly 21, 2020 FAT-AUS-980
St Barbara
An early peek
St Barbara has released an early update on its June quarter and 2020 full year operational results. The announcement revealed a rise in June quarter and 2020 gold production that came within guidance for the year, but toward the bottom end of the range. On the individual mine performances against 2020 guidance, one came in ahead, one within and one below. While a glimpse of the balance sheet to end June 2020 shows that it remains in good shape. The following table summarises St Barbara’s operational results:
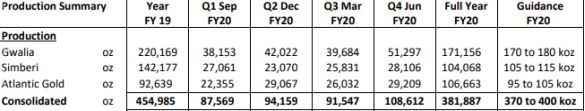
Source: St Barbara
Gold production for the June 2020 quarter was 26% higher year-on-year (yoy), at 108,612 ounces, with annual production 5.4% higher yoy, at 381,887 ounces.
The Atlantic mine, as Members can see from the above table, was the standout for the year, with annual production coming in ahead of 2020 guidance. While on the disappointing side was the Simberi mine with operational issues impacting performance over the year. The Gwalia mine operated as expected over the year.
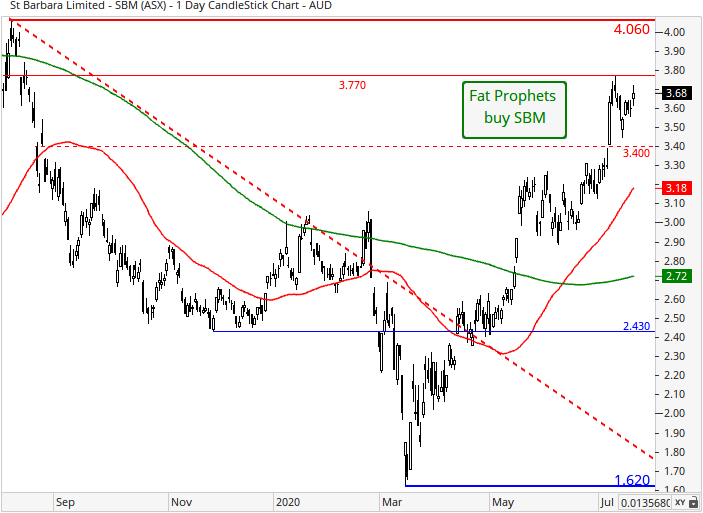
Turning to the technical picture, and from a daily view there have been a number of encouraging developments since the March lows. Prices have moved above dynamic resistance at both the 50 and 200 day moving averages – being $2.72 and $3.18 respectively. A bullish moving average crossover has formed, and a new buttress has been established at $3.40. A near-term target is for a move above resistance at $3.77.
Data on the balance sheet shows that it remains in good shape at end June 2020. Cash stood at A$406 million and debts at A$316 million, to give St Barbara a net cash position of A$90 million. From the data provided we have no concerns over the structure of the balance sheet.
St Barbara did not provide cost details or 2021 guidance. Full clarity on costs will be provided with the release of the June quarter and full year operational results later in the month.
The June quarter and full year operational update revealed, in our view, a good result on rising quarterly and annual gold production for 2020. The result reflects the importance of the Atlantic acquisition, with this mine delivering an outstanding result for 2020.
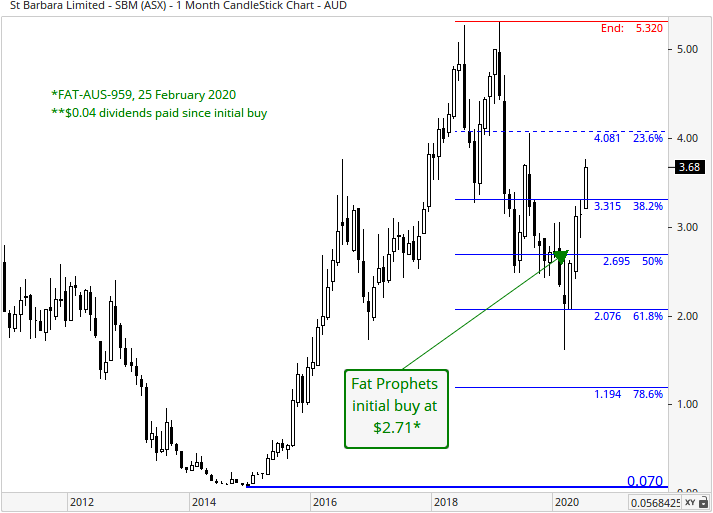
On the monthly chart, downward momentum appears to have dissipated last year, after a deep correction from the highs around $5.32, with support coming in around the 50% Fibonacci retracement at $2.70. The subsequent bounce has seen $3.32 eclipsed, being the 38.2% Fibonacci retracement. The 23.6% Fib at $4.08 is in sight, as the next target.
Overall mine production returned, for the first time in two years, to gold production of over 100,000 ounces in a quarter (excluding production from the Atlantic acquisition). A production metric we were looking for when returning St Barbara to the portfolio back in February 2020. St Barbara will release its 2020 operational results on 29 July 2020, at which time we will provide a full review.
In the meantime, we continue to recommend St Barbara as a buy for Members who have an appropriate risk tolerance and medium to long-term investment horizon.
Disclosure: Interests associated with Fat Prophets holds shares in St Barbara.