Gold hits a new record
It was only a month ago that we upgraded our end of year price target for gold to a price range of US$1,925 to US$2,000 an ounce from our previous target range of US$1,625 to US$1,675 an ounce. The gold price at the time of writing in June was trading around US$1,780 an ounce. The gold price in recent trading hit a new record at circa US$1,970 an ounce to compress six months of price action into one month. The following chart shows the long-term US gold price:
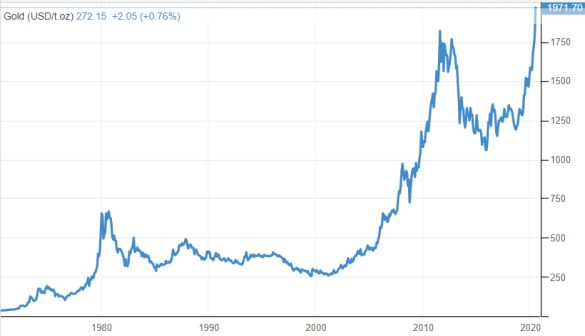
Source: Trading Economics
DISCLAIMER
Fat Prophets has made every effort to ensure the reliability of the views and recommendations expressed in the reports published on its websites. Fat Prophets research is based upon information known to us or which was obtained from sources which we believed to be reliable and accurate at time of publication. However, like the markets, we are not perfect. This report is prepared for general information only, and as such, the specific needs, investment objectives or financial situation of any particular user have not been taken into consideration. Individuals should therefore discuss, with their financial planner or advisor, the merits of each recommendation for their own specific circumstances and realise that not all investments will be appropriate for all subscribers. To the extent permitted by law, Fat Prophets and its employees, agents and authorised representatives exclude all liability for any loss or damage (including indirect, special, or consequential loss or damage) arising from the use of, or reliance on, any information within the report whether or not caused by any negligent act or omission. If the law prohibits the exclusion of such liability, Fat Prophets hereby limits its liability, to the extent permitted by law, to the resupply of the said information or the cost of the said resupply.
Funds Management – In addition to the listed funds FPC, FPP and FATP, Fat Prophets Pty Ltd manages the separately managed accounts, namely Concentrated Australian Shares, Australian Shares Income, Small Midcap, Global Opportunities, Mining & resources, Asian Share, European Share and North American Share. These SMAs are managed under their own mandates by the fund managers, and this is independent to the research reports.
Staff trading – Fat Prophets Pty Ltd, its directors, employees and associates of Fat Prophets may hold interests in many ASX-listed Australian companies which may or may not be mentioned or recommended in the Fat Prophets newsletter. These positions may change at any time, without notice. To manage the conflict between personal dealing and newsletter recommendations the directors, employees, and associates of Fat Prophets Pty Ltd cannot knowingly trade in a stock 48 hours either side of a buy or sell recommendation being made in the Fat Prophets newsletter. Staff trades are pre-approved by an appointed staff trading compliance officer to ensure compliance with the staff trading policy.
For positions that directors and/or associates of the Fat Prophets group of companies currently hold in, please click here.