
Staying with Queensland
The initial investor response to Bank of Queensland’s FY18 results was positive. Although the results were a mixed bag; the key cash earnings metric was higher than expected and net interest margins expanded. We also like the relative “flexibility” advantage the bank offers. Valuations in the sector are undemanding after a period of negative sentiment.
The Royal Commission highlighted many aspects of bad behaviour in the financial industry, although the focus was generally on the larger players. Bank of Queensland’s (ASX:BOQ) relatively simpler model – it does not have a wealth management business – means less likelihood of conflicts within its business and therefore we believe BOQ is well placed to quickly adapt to any changes required from the conclusion of the Royal Commission.
FY18 headline numbers
Turning to FY18 numbers and BOQ’s statutory net profit after tax (NPAT) of $336 million marked a 5% decrease from the prior year, with the FY18 figure reduced by several one-off items, including accelerated amortisation expense to provide capacity for additional capital initiatives planned for FY19-20. It also includes $9 million in external legal costs related to the Royal Commission.
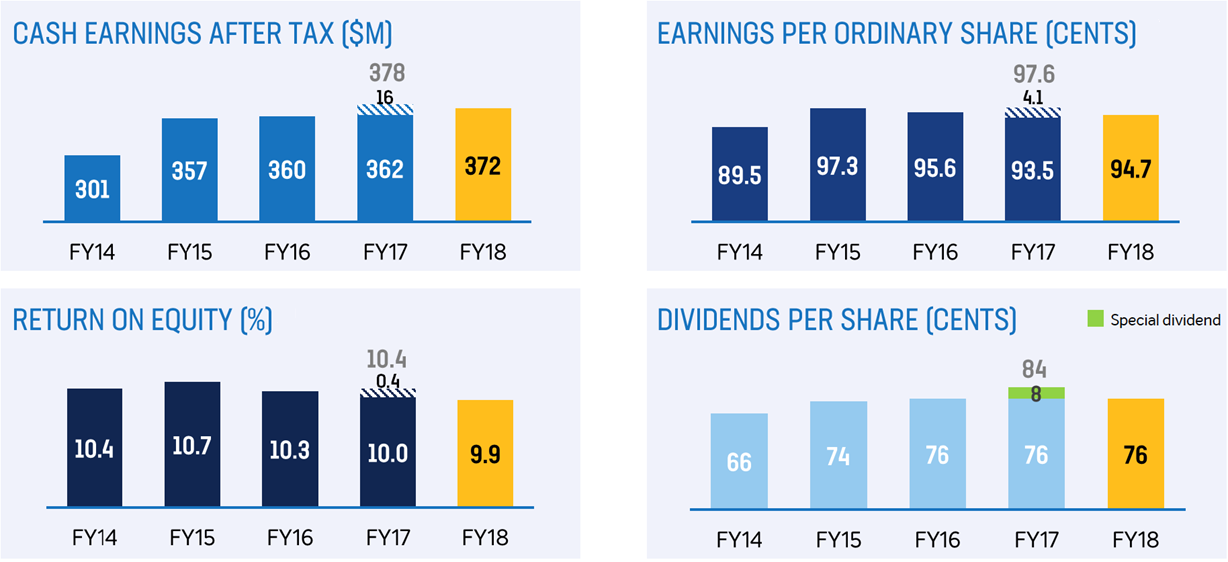
The more closely watched cash earnings after tax figure was down 2% from FY17 to $372 million.
We note though that the year ago figure was boosted by $16 million from the disposal of a vendor finance entity and adjusting for that, cash earnings were up 3% on an underlying basis. BOQ’s reported FY18 cash earnings of $372 million equated to cash basic earnings per share of 94.7 cents, down roughly 3% year-on-year. Nevertheless, cash earnings per share easily topped the 90-cent consensus forecast. And on an adjusted basis, cash earnings per share ticked up 1%.
Return on equity decreased 50 basis points to 9.9% and was down 10 basis points on an adjusted basis. The bank maintained a fully franked final dividend of 38 cents per ordinary share, resulting in dividends for the full year of 76 cents. That was flat with ordinary dividends of 76 cents in FY17, although last year BOQ bolstered that with a special dividend of 8 cents per share to take the total dividends to 84 cents.
Source: BOQ (ASX:BOQ)
Total revenue ticked up 1% to $1,110 million and was up 2% on an underlying basis, despite “significant headwinds facing the sector.” The increase was achieved through lending growth and a modest lift in the net interest margin. CEO Jon Sutton said the bank “managed the environment we are faced with, prioritising margin over growth.”
Looking at the components of revenue and net interest income increased by 4% or $39 million from FY17 to $965 million in FY18, driven by a 2% increase in average interest earnings assets and a 5-basis point improvement in net interest margin (NIM) to 1.98%.
BOQ was one of the first banks to lift mortgage interest rates in response to higher funding costs faced during the financial year. An improved funding mix also supported NIM.
BOQ’s total lending growth of approximately $1.5 billion (+4%) for the year was propelled by above-system (1.2x) growth in targeted niche commercial lending segments, along with increasing the mortgage book for Virgin Money Australia (VMA) and BOQ Specialist. The latter two businesses have grown to the point where they now account for 20% of the loan portfolio.

Source: BOQ (ASX:BOQ)
The bank has been diversifying its business geographically with Queensland exposure dipping 2 percentage points year-on-year to 44% and down from 60% in 2012. The bank has also been growing its business division, with the BOQ business division growing to the level where it now contributes roughly 60% of cash earnings. In FY18, the business increased its cash earnings by 10% on revenue growth of 5%.

Source: BOQ (ASX:BOQ)
The increase in the much larger core net interest income line more than offset a 17% fall in non-interest income to $145 million, with about half of the decline attributed to the sale of the vendor finance entity in FY17.
Another headwind came from the industry-wide decline in income from interchange fees and lower merchant fees.
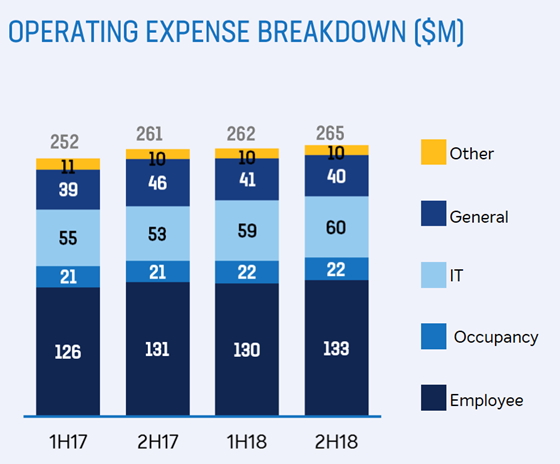
Total operating expenses increased 3% year-on-year to $527 million, mainly driven by higher amortisation as BOQ invests in technology to digitise the business over the long-term. This should lead to the dual benefit of improving the customer experience and business efficiency. Core expense growth was up 1%. Like other banks, BOQ is facing rising compliance costs. Due to higher operating expenses, the cost to income ratio increased 90 basis points year-on-year to 47.5%.
Source: BOQ (ASX:BOQ)
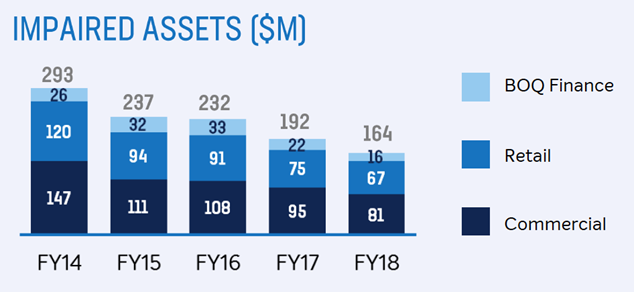
Underlying profit edged down 1% to $583 million. Loan impairment expense declined 15% to $41 million, or 9 basis points of gross loans. Impaired assets were also 15% lower at $164 million. Arrears continue to be at benign levels.
Source: BOQ (ASX:BOQ)
Due to the reduction in loan impairment expense, profit before tax was effectively flat year-on-year at $542 million. Income tax expense increased, resulting in the previously discussed 3% decline in cash earnings to $372 million (before adjustments).
Although the common equity tier 1 ratio declined year-on-year, it remained robust at year-end for a “smaller” bank at 9.31%. Thus, the bank is in a strong position to weather any deterioration in the housing market when it comes. Queensland too, where BOQ continues to have much of its exposure, has not seen the breakneck price growth seen in parts of NSW and Victoria. This should also help insulate it from some of the impact under a dire scenario.

Turning to the technical picture and on the daily chart, multiple levels of support have given way in 2018. Prices have though at least recently risen back off the 127.2% Fibonacci retracement at $9.85. For the short-term technical outlook to improve, a sustained break above the 50-day moving average (red line) of $11.03 is required. Should this occur, then momentum would once again shift in favour of the bull-camp.

Regarding the monthly chart, prices have reclaimed support at the long-term 50% Fibonacci retracement region of $10.34. Previous layers of support between $11.62 and $12.07 have ceded. Looking further ahead, and for the broader technical outlook to strengthen, prices need to close (on a monthly-basis) back above these levels which now act as resistance.
Summary
Bank of Queensland (ASX:BOQ) shares look good value for patient investors in our view, trading on 14.1 times FY19 projected earnings, while the projected yield is 6.6%.
Despite a challenging environment for banks, Bank of Queensland (ASX:BOQ) delivered another solid result for FY18 and its business evolution was evident, with increasing diversification.
Going forward, we remain confident in the bank’s ability to deliver growth through niche business channels, including the Specialist medical business, Virgin Money and Business Banking.
We are optimistic on the prospects for the Queensland economy, and particularly the Gold Coast, with tourism on the up and its appeal to migrants. Our view on the direction of the Australian dollar and commodity prices supports this view.
Given the regulatory and political pressure on large banks, the regional, more nimble players should be able to pick up market share as the ‘playing field’ is levelled somewhat.
We recommend the Bank of Queensland (ASX:BOQ) as a buy to Members with no exposure and a medium to long-term investment time frame.
Disclosure: Bank of Queensland (ASX:BOQ) is held within the Fat Prophets Concentrated Australian Share, Australian Share Income and Small & Mid cap managed account portfolios.

