
A solid half all round
Woodside Petroleum (ASX:WPL) reported an improvement in its first half underlying profit for 2018. The company announced a surge in sales revenue, as production and oil prices delivered for the half. The balance sheet reaped the benefit of the financial performance for the half, to step further up the quality scale. Shareholders received a boost in the interim dividend. The following table shows a summary of the company’s first half result (in US Dollars):

Source: Woodside petroleum (ASX:WPL)
We consider the first half result was a solid one and see nothing in it, that the company controls, that could be detrimental to it reporting a good full year result. The company will report its 2018 result in February 2019.
On an underlying basis, net profit increased by 10.8% on the year earlier result, to US$541 million. The following chart shows the factors that impacted on the company’s first half result (in US Dollars):
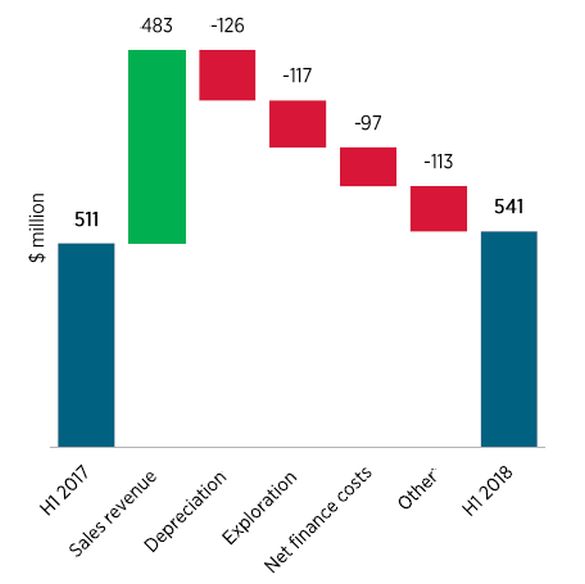
Source: Woodside petroleum (ASX:WPL)
As Members can see from the above chart, driving the result was the US$483 million attributable to increased sales revenue in the first half. This figure compares very favourably to the negative US$45 million reported for the first half 2017. Operating revenue surged to US$2.3 billion, representing a rise of 27% on the year earlier result.
Behind the sales revenue surge were improved production and higher realised oil prices. On the operational performance for the half, production was 5% higher compared to the same half 2017, at 44.3 million barrels of oil equivalent (boe). The arrival of first production from Wheatstone (Woodside’s interest 13%) added 3.1 million boe and Pluto (Woodside’s interest 90%) 1.9 million boe. On guidance for 2018, the company upgraded its forecast production to be in the range of 87 million to 91 million boe, compared to the previous 85 million to 90 million boe range.

Turning to the daily chart, prices have accelerated sharply since the March lows. Prices have now pushed above a layer of resistance at $35.96 being the 61.8% Fibonacci retracement. The existence of a bullish crossover, where the 50 day moving average (red line) cross the 200 day moving average (green line), in April, is also a positive development.
Realised average prices also delivered a tailwind over the first half 2018, following the company reporting a rise in energy prices. The company reported a 18% increase in its average released oil price compared to the first half 2017, to US$51 per boe. We remain positive on the outlook for energy prices over the remainder of 2018, with a calendar year-end range for West Texas Intermediate (WTI) in the range of US$70 to US$80 a barrel and for Brent US$74 to US$84 a barrel. WTI is currently trading around US$70 a barrel and Brent US$79.
On costs for the first half, the company reported a flat result compared to the year earlier result, of US$10 per boe. The following figure shows first half costs and margins:

Source: Woodside petroleum (ASX:WPL)
As Members can see from the above chart, both operating costs and other costs were unchanged on the year earlier result. The company maintained its cost structures, especially operating costs, on greater activity. Operating costs for 2018 are forecast to be in the range of US$5.50 to US$5.80 per boe. The company is on track to achieve guidance for the year.
The balance sheet continues to improve, with net debt falling to US$3.0 billion at 30 June 2018 compared to US$4.7 billion from a year earlier. The improvement in net debt was reflected in the company’s gearing ratio at 30 June 2018 of 15% compared to 24% for the corresponding half for 2017. The company targets a gearing level in the range of 10% to 30% and sits comfortably mid-way through the range at 30 June 2018. We have no concerns over the structure of the company’s balance sheet.
Shareholders benefited from the better financial result for the first half, with the company declaring a higher interim dividend. A fully franked interim dividend of US53 cents was declared for the first half, compared to a fully franked interim dividend of US49 cents from a year earlier.

With reference to the monthly chart, prices have entered a bullish phase of the overall technical cycle with today’s high of $38.05. We now envisage a broader upwards rotation towards resistance, located at the 78.6% Fibonacci retracement of $39.34 (red set of retracements).
Our belief in Asia’s growing energy needs has not abated and will continue to generate long-term value creating opportunities for Woodside Petroleum. Moreover, a strong balance sheet matched with a robust cash flow profile delivers a financial platform capable of supporting new growth initiatives. We have questioned in the past the company’s growth profile, or lack of, but now consider it has a portfolio capable of producing 100 million boe per annum by 2020. Importantly, the company’s approach has been patient and has lacked a cash splash.
We believe the company is now in the best position financially, to forge ahead with its proposed developments.
Consequently, we reiterate our buy recommendation for Members with no exposure to Woodside Petroleum (ASX:WPL).
Disclosure: Woodside Petroleum (ASX:WPL) is held within the Fat Prophets Mining & Resources managed account portfolio.

