
Fat Prophets Take Profits
The property market in Australia is having a challenging time of it currently, with the tightening of credit standards and overall slowing of market activity resulting in fewer buyers, rising inventory levels and compounded by affordability challenges for first time homebuyers. With lending rates also now on the rise we see the headwinds deepening, particularly in hot spots which have experienced robust price gains in recent years. Regions which have lagged may hold up better, but we are nonetheless exercising prudence in taking profits on Sunshine state developer, Sunland Group (ASX:SDG).
What’s New?
In our last coverage in May (FAT-AUS-875) we focussed on the company’s “Grace on Coronation” project located at Lot 30 Coronation Drive, in Toowong, Queensland which is still in legal limbo. We also looked at the company’s First Half 2018 results which indicated a very solid start to the financial year.
However, property market concerns were already surfacing as the company provided a conservative FY18 outlook with an NPAT target of between $27 and $30 million. Developments since then don’t augur well for the property sector and consequently, Sunland itself.
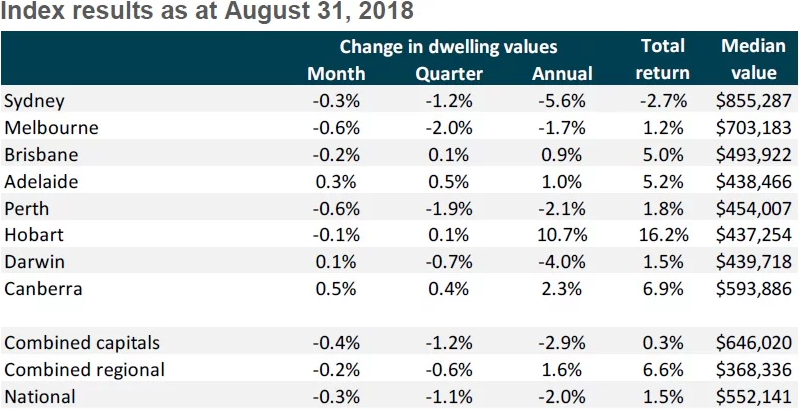
Over the past 11 months, property prices have been cooling down with Sydney and Melbourne down 5.6% and 3.5% from their respective highs. This weakening market conditions for property are tied to a varied mix of factors led by the introduction of stricter lending criteria by the banks and affecting investor demand.
The table below illustrates the price movements across a mix of time periods and continues to show a weakening market:
Source: CoreLogic
Conceptually, the introduction of stricter lending criteria by the banks was originally intended to dampen “investor” demand (reduce lending to high loan-to-income borrowers) and reduce some upwards price pressure, but instead it became a double-edged sword and also hurt first homebuyers (i.e. actual consumers).
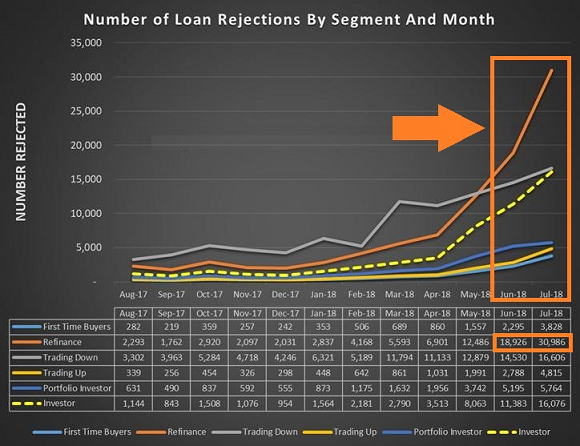
A concerning statistic with data from Digital Finance Analytics (DFA), a boutique consulting firm, and investment bank UBS, indicate a massive spike in Mortgage rejections with DFA founder Martin North stating that “about 40% of people who tried to refinance were unable to do so” and added that “…if you go back a year it was 5%.” This is a very concerning trend indeed.
Source: Digital Finance Analytics
Furthermore, a broadening number of Australian homeowners are experiencing mortgage stress. This is defined as a household where 30% of the post-tax income goes to servicing a mortgage, implying a greater degree of financial risk for the system. The concerning factor here is that about 30.5% owner occupied borrowing households are experiencing this.
With fewer buyers and owners experiencing financial distress, no surprise that this would result in a negative feedback loop with sellers trying to exit their “mortgage hand-cuffs”.
We see a build-up in supply and as evidenced by research from CoreLogic, a data analytics firm, which noted that inventory levels have been rising due to fewer buyers with advertised “stock” levels 7.6% higher year-on-year. Properties generally are taking much longer to sell with auction clearance rates in the mid- to low- 50% range.
This is supported by data from property site, Domain, showcasing preliminary Auction results:

Source: Domain
The increasing desperation to some vendors to head for the exits has been only fuelled by media anecdotes that there are sellers (of mid-range properties) willing to lop off $250,000 off their initial asking prices just to close a deal.
Despite the increasing ‘doom and gloom’, Sunland’s share price has held quite well and has been trading in a band between $1.67 and the $1.80s levels. We believe this is primarily due to the fact that the company has a larger exposure to Queensland which was lagged, and could potentially hold up better in a national downturn.
However, we believe it prudent to move to a SELL recommendation at current levels, with the company likely to face increasing industry headwinds. While the likes of South-East Queensland may hold up well (and helped by rising tourism and investment), the company has exposure to the Brisbane apartment market (where there is oversupply) as well as south of the border. Borrowing on the aphorism from New England Council’s slogan “a rising tide lifts all the boats”, the converse is true as well.
Indeed, the company’s FY 18 results were something of a disappointment and reflective of a slowdown in the broader market. In the 2H18 it seems that the actual performance slowed significantly and ended with an unfavourable year-on-year comparison and only slightly beating guidance estimates between $27 and $30 million. Results are summarised below:

Source: 22 August 2018 Company Presentation
Going forward, the company’s outlook isn’t entirely positive. Note that many CEOs and management are usually “bullish” in order to rally investors and internal morale. However, Managing Director, Sahba Abedian, has provided a more muted and, in our view, realistic portrayal of next year’s outlook, quote:
“Following a nine-year period of expansion, the Australian property market has entered an inevitable phase of consolidation and adjustment,” and further added that “…this is the natural consequence of the cyclical nature of our industry and evidenced by a reduction in the volume of property sales, a reduction in foreign investment, a tightening of the lending environment, and softening economic conditions.”
If an industry expert such as himself would urge caution, we believe it is most prudent to listen and act accordingly. He also added that Sunland management are now “focussed on establishing the Company for the next phase of the cycle” instead of attempting to “ease” concerns and offer glib remarks about a better near term. This thus supports our view to move to a SELL.
Turning to the daily chart, prices have breached support at the 50-day moving average (red line) of $1.77. As such, downside support at the mid-September low of $1.59 as marked by the horizontal blue line, is now potentially in for a test. In order for the short-term technical outlook to improve, a sustained break above dynamic resistance indicated at the 200-day moving average (green line) of $1.76 is required. A bearish crossover (where the 50 day moving average crosses below the 200 day moving average) does little to instil confidence this will occur.

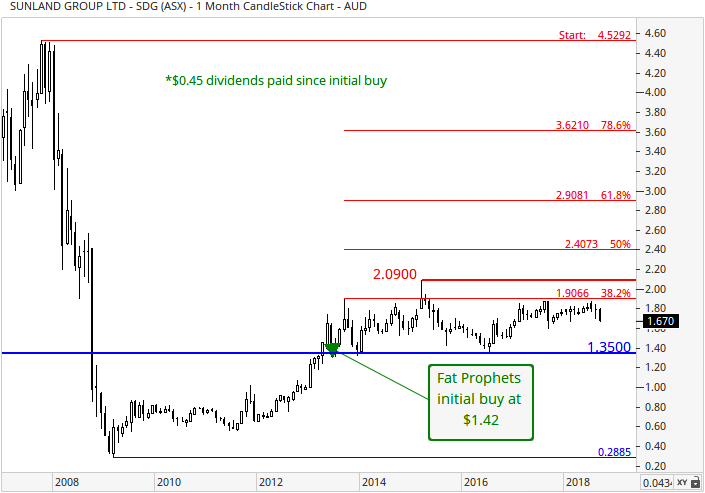
With reference to the monthly chart, overhead resistance is situated at the 38.2% Fibonacci retracement of $1.91. A sustained break above this level would bolster upward momentum and strengthen the long-term technical landscape. On the flip side an ongoing rotation south could see the $1.35 level threatened.
Summary
The property market in Australia is having a challenging time of it currently, with the tightening of credit standards and overall slowing of market activity resulting in fewer buyers, rising inventory levels and compounded by affordability challenges for first time homebuyers. With lending rates also now on the rise we see the headwinds deepening, particularly in hot spots which have experienced robust price gains in recent years.
These difficulties have bled into Sunland’s Fiscal 2018 results, showcasing a significant slowdown. Management has likewise expressed muted expectations of the future instead of glib remarks. We recommend Members SELL all their holdings in Sunland Group (ASX:SDG) around current levels.

