
Managing Headwinds
Despite a cooling of the Australian property market, Stockland (ASX:SGP) continues to look well placed to deliver mid-single digit growth in funds from operations over the next couple of years, due to higher average residential selling prices, a higher proportion of medium density settlements, higher margins, pipeline of projects and a positive shift in asset mix. This will be supplemented by the recently announced securities buy-back. Accordingly, we retain our buy rating.
Earlier this month Stockland (ASX:SGP) announced an on-market buy-back of up to $350 million of Stockland securities on issue. The company intends to finance the buy-back from existing facilities and remain in place for 24 months from the commencement date of 21 September 2018. The debt load is currently modest, with gearing of just 22.2% of assets at the end of the fiscal year. Stockland also intends to divest around $400 million worth of retail town centres over the next two years as part of its recalibration of its asset portfolio.
FY18 snapshot
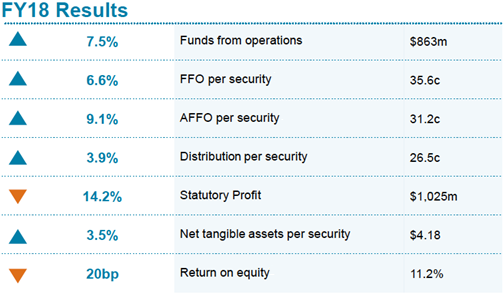
Turning to the FY18 results and revenue from ordinary activities edged up 1.1% to $2,775 million. The closely watched funds from operations (FFO) metric grew 7.5% year-to-year to $863 million, while FFO per security of 35.6 cents was up 6.6% and came in slightly above the top end of the company’s initial guidance range of 5% to 6.5% growth. The company has delivered an annual compound growth rate of 10.8% over the past five years.
Adjusted funds from operations (AFFO) increased 9.9% to $756 million and AFFO per security of 31.2 cents marked a 9.1% increase on the year ago figure. Statutory profit on the other hand declined 14.2% year-on-year to $1,025 million.
The following table shows the reconciliation for statutory profit to FFO and AFFO with some of the largest variances being commercial property revaluations, mark-to-market changes on financial instruments and tax:

Source: Stockland (ASX:SGP) FY17 presentation
The distribution was 26.5 cents per security as expected, representing a 4.1% increase from the prior year.
This represented a pay-out ratio of 75% of FFO. The return on equity edged down 20 basis points to 11.2%. Net tangible assets per security ticked up 3.5% year-on-year to $4.18. The balance sheet continues to be strong, with gearing, as measured by Stockland, falling 50 basis points to 22.2% and near the bottom end of the targeted 20% to 30% range. The weighted average debt maturity increased 0.5 years to 6.2 years. Interest cover was stable at 4.8 times.
Source: Stockland (ASX:SGP) FY17 presentation
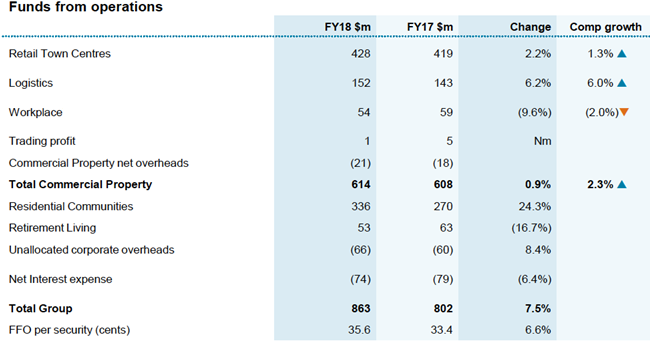
Looking at the components of the key FFO measure, and commercial property continued to be a key driver although growth moderated. The segment comprises retail town centres and workplace and logistics assets.
There was comparable growth in FFO of 2.3% across the portfolio to $614 million. In absolute terms, it ticked up 0.9%. During the year, the company launched its $421 million redevelopment of the Stockland Green Hills shopping centre in Maitland, NSW; the largest retail redevelopment in the company’s history. The project is expected to achieve an incremental IRR (internal rate of return) of around 12% in the 10 years post-completion and an incremental, stabilised FFO yield of about 7%.
The retail town centre business delivered comparable FFO growth of 1.3% and funds from operations were up 2.2% on an absolute basis to $428 million.
Comparable growth was impacted by higher outgoings (higher electricity and government charges) and retail remixing. Foot traffic was up 2.5% and income from growth categories such as food, dining, leisure, cinemas and services now represents 41% of speciality store income. This is a trend across the industry, making shopping malls more of a destination for an afternoon or evening outing.
Occupancy across the retail town centres portfolio edged down by 0.1 percentage point from a year earlier but remained a strong 99.4%. Comparable speciality sales increased 4.2% year-on-year to $9,378 per square metre. Total MAT (moving annual turnover) increased 3.4%, with strong growth in categories such as mobile phones (+7.7%), retail services (+7.6%) and general retail (+6.5%). Apparel continued to be a laggard with MAT declining 3.4%. Stockland’s town centres are underweight categories such as apparel and jewellery that are generally facing declining sales.
Source: Stockland (ASX:SGP)
The logistics portfolio continued to deliver solid comparable FFO growth of 6.0%, although that marked a slowdown from the pace a year ago. FFO from the portfolio increased 6.2% in absolute terms to $152 million. Occupancy remained robust at 98.7%. On the development side, the $77 million Coopers Paddock Logistics Centre in Warwick Farm completed during the year the project was fully leased and saw a 23.7% increase in valuation upon completion. It has achieved an initial yield of 7.3% and is expected to deliver an IRR of 10.7%. The future pipeline, valued at approximately $600 million is primarily focused on the eastern seaboard.
The workplace (office) portfolio FFO of $59 million was down 9.6% on an absolute basis, while comparable FFO was down 2%, reflecting the ongoing vacancy in the Perth asset. Most of the portfolio is in the strong performing Sydney market. Stockland continues to divest some assets in the segment and completed the sale of a non-core Canberra office for consideration of $24 million post the balance date for the FY18 results.
The residential business settled 6,438 lots, marking a 2.5% decrease from FY17’s record high figure of 6,604 lots. Operating profit from this segment surged 24.3% to $336 million due to higher selling prices and margins. The company said it had “solid” volumes of net deposits from high margin Sydney and Melbourne projects, providing good profit visibility for the segment in FY19. Stockland (ASX:SGP) is continuing to expand its medium density residential business.
Finally, the retirement living segment had a softer year in FY18 with this previously flagged by management. Operating profit for the segment declined 16.7% to $53 million. The sector faced some headwinds from adverse media coverage earlier in the year and interestingly, the aged care sector will soon be under the spotlight from the freshly announced Royal Commission. Net reservations and enquiry levels did improve over the course of the year and fourth quarter sales were up 14.9% year-on-year.
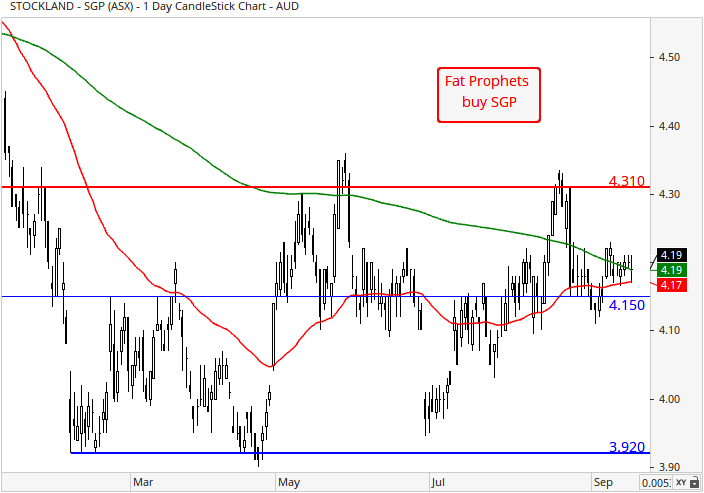
Turning to the charts, and the technical picture has improved in recent months. On the daily, prices are now trading around both the 50 day (red line) and 200 day (green line) moving averages. Support at $4.15 has been retaken, and opens the prospect for a move towards the next buttress at $4.31.
With reference to the monthly chart, support is indicated at the 38.2% Fibonacci retracement of $3.91 (blue set of retracements). In the grand scheme of things, the broader uptrend remains in play as evident from the series of higher lows and higher highs in formation since 2010, despite the spell of weakness in price-action (the breach of the upward sloping green dashed-line). For the bull-camp to regain upward traction, prices would need to trade back above the long-term uptrend line of $4.48.

Summary
Despite a cooling of the Australian property market, Stockland (ASX:SGP) continues to look well placed to deliver mid-single digit growth in funds from operations over the next couple of years, due to higher average residential selling prices, a higher proportion of medium density settlements, higher margins, pipeline of projects and a positive shift in asset mix. This will be supplemented by the recently announced securities buy-back. We also believe there is significant value in the company’s residential land bank. Stockland has guided for FFO per security growth of 5% to 7% for FY19.
Given the recent pullback in Stockland (ASX:SGP) shares the valuation appears undemanding, trading on approximately 9.4 times forecast FY19 earnings, with a projected dividend yield of 6.7%.
We recommend Stockland (ASX:SGP) as a buy for Members with no exposure and a medium to long-term investment time horizon.
Disclosure: Stockland (ASX:SGP) is held in the Fat Prophets Income Model Portfolio.

