
1H18; a great follow-on from FY17
It has been a while since Santos (ASX:STO) has reported the likes of the strong comparatives seen in the 2018 first half result. The company reported a doubling of underlying profits, as it reported net profit moved back into the black. Despite net cash from operations coming in flat, but at an ample quantity, the balance sheet improved. Moreover, shareholders received the first dividend in sometime. The following table shows a summary of the company’ first half result (EBITDAX – earnings before interest taxation depreciation amortisation exploration, nm – not meaningful, cps – cents per share):

Source: Santos (ASX:STO)
On higher product sales as shown in the above table, revenue increased by 16% on the same half 2017, to US$1.7 billion. Product sale increased despite the February 2018 earthquake that took the Papua New Guinea liquid natural gas plant (PNG LNG, Santos’s interest 13.5%) off-line for a number of weeks.
Sale volume guidance for 2018 has been maintained and is forecast to be in the range of 72 million to 76 million barrels of oil equivalent (boe). In 2017, the company produced 59.5 million boe.
The company also reported higher average realised oil price, which jumped 38% on the year earlier outcome, to US$75 a barrel. Over the same period as for the realised oil price, the LNG price jumped 24% on the year earlier result, to US$8.96 per million British thermal units. We remain positive on the outlook for energy prices over the remainder of 2018, with a calendar year-end range for West Texas Intermediate (WTI) in the range of US$70 to US$80 a barrel and for Brent US$74 to US$84 a barrel. WTI is current trading at US$70.01 a barrel and Brent US$77.80.
On the better revenue number, the company reported a net profit after taxation of US$104 million compared to a loss of US$506 million for the first half 2017. Another key metric that impacted positively on the result was net impairment losses for the half that amounted to negative US$76 million compared to negative US$920 million from a year earlier. The company was not required to write down the value of its assets for the first half 2018, due to favourable energy prices.
Cash flow for the reported half moved modestly higher by 0.06% on the first half 2017, to US$644 million. The balance sheet continued to improve, with the company reporting a net debt at 30 June 2018 of US$2.4 billion compared to the US$2.9 billion from a year earlier. In absolute terms the balance sheet improved at 30 June 2018. Gearing on a net debt to net debt plus equity basis only moved modestly to 35.5% from 35.4% from a year earlier. We have no concerns with the structure of the balance sheet.
The standout feature in the result was the return of dividends, with the company declaring an interim dividend of A3.5 cents per share. No dividend was declared for the first half 2017. We believe the return of dividends reflects management discipline and confidence that the current structure of the company can support future dividend payouts.
We see nothing in the first half result that could be detriment to the company on a full year basis.

Turning to the daily chart, the near-term charting structure has improved significantly this year. Prices have moved above dynamic support at the 50 day moving average (now $6.53) and have also taken out resistance at $6.70. The next target is $7.40, being the 2015 high. Medium-term momentum remains in favour of the bulls, as backed by the bullish moving average crossover present since September 2017. This is when the 50-day moving average (red line) crosses above the 200-day moving average (green line).
The company has acquired Quadrant Energy for US$2.15 billion in cash and debt, plus a future contingency payment of US$50 million and a potential ongoing royalty. Quadrant Energy’s assets are all in Western Australia. We consider the acquisition consideration to be fair and reasonable based on the assets acquired. The following table shows the ownership structure of Quadrant Energy’s current assets (the ownership interest above the red line will fall to Santos post completion of the Quadrant Energy acquisition, FPSO – floating production storage offload platform and TJ – terrajoules):

Source: Santos (ASX:STO)
Funding will be through existing cash of US$950 million and a debt facility of US$1.2 billion. We have no concerns over the structure of the finance package and are of the view that the balance sheet has ample room to carry the additional debt load.
A key takeaway for Santos is the reduction in its 2018 free cash flow breakeven figure to US$32 per barrel, which represents a reduction of US$4 per barrel on the current estimate.
Other notable features that the acquisition will bring to Santos includes, production of around 19 million barrels of oil equivalent per annum and an initial 12-year production life based on current 2P (proved plus probable) reserves. The company expects the acquisition will be “materially” earnings per share and cash flow per share accretive.
Geographically, the assets of Quadrant Energy enhance the existing assets that the company already has in the region of Western Australia, and are shown in the following figure:

Source: Santos (ASX:STO)
The company will certainly, we believe, achieve the synergy savings in the range of US$30 million to US$50 million. Moreover, the mix of oil/liquids and natural gas production acquired through Quadrant Energy will further diversify the company’s product offerings.
On the Quadrant Energy acquisition, we consider the assets will add value to the company’s existing asset base and overall gas supply strategy, both domestically into Australia and to export markets.
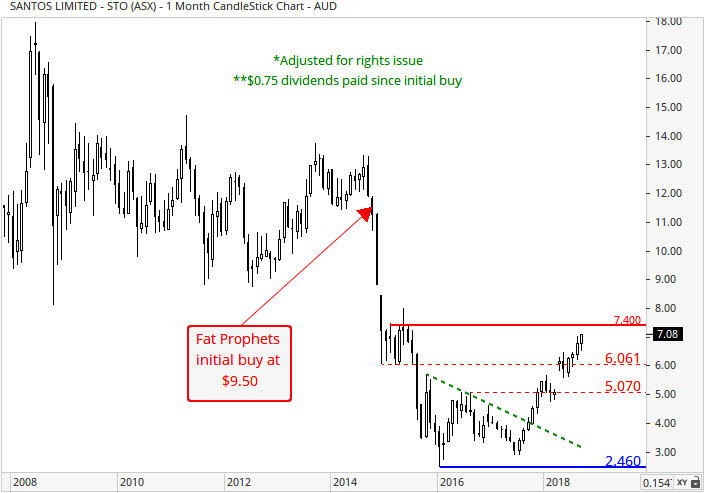
With reference to the monthly chart, a major low was printed in January 2016 of $2.46 as shown by the horizontal blue line. This led to a healthy recovery in the share price, printing a high of $5.07 in August 2016 (horizontal thin-red line). A resumption of the downtrend then followed until June 2017. Positively, the bull-camp eventually stepped up their game and drove prices north, and in the process, an upward breakout above the short-term downtrend line (downward sloping dashed-green line) evolved in September. A climb above the next band of overhead resistance located between $5.07 and $6.06 has also occurred. From a longer term perspective the 2015 high at $7.40 is also coming into focus.
We hold to the belief that Santos (ASX:STO) has brought itself to a position where it can continue to participate in meeting Asia’s expanding long-term energy demands. A view very much reinforced by the first half result. The company has a deep pipeline of energy projects, which we believe can delivering energy products into the Asian market in across the time spectrum. Moreover, it is this long-term production profile that the assets of Santos feature, and will, we believe, drive future shareholder value.
Consequently, we continue to recommend Santos (ASX:STO) as a hold.

