
FY18; It’s all in the prices
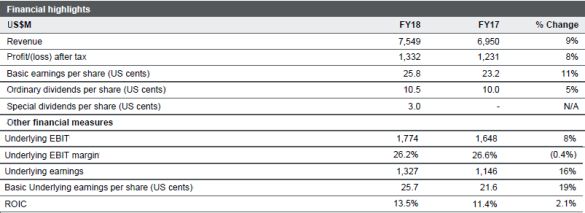
South32 (ASX:S32) has delivered a good full year result, reporting higher underlying earnings for 2018 on the back of better commodity prices. Operations delivered an underwhelming result for 2018 that was reflected in the financials. On better revenues, the company reported a fall in net operating cash flow, but the balance sheet continues to step-up in quality. Moreover, the better financial result allowed the company to deliver for its shareholders on the dividend front, and with gusto. The following table shows a summary of the company’s 2018 result (EBIT- earnings before interest and taxation, ROIC – return on invested capital):
Source: South32 (ASX:S32)
We consider the 2018 headline numbers reported by the company were satisfactory, given the impact of higher realised commodity prices on the result. Operations were less than impressive in 2018 and did act as a partial drag on the financial result.
On an underlying earnings basis, the company reported a 15.7% rise compared to 2017, to US$1.3 billion. Moreover, reported profit after taxation, as Members can see from the above table, rose by a modest 8.2% compared to 2017, to US$1.3 billion.
One major factor, in higher realised commodity prices, drove the profit results for the full year.
The following chart shows the factors that impacted on the company’s underlying earnings in 2018:

Source: South32 (ASX:S32)
Improved prices for sales, as Members can see from the above chart, contributed US$1.5 billion to the 2018 result compared to the positive US$1.9 billion in 2017. Going forward, trade frictions between the United States (US) and many countries, but especially China, are weighing on future global economic growth outlooks and with that commodity prices.
Adding to the headwind, the US Dollar has risen on anticipation that tariffs are designed to repair the negative trade balance that the US has with the world and especially China. A rise that has caused weakness in the broader commodity prices, and especially the base metals offered by the company. We expect that 2019 will bring with it less sales price momentum again and have a detrimental impact on earnings.
Operations for 2018 were a big disappointment with sales volumes contributing a negative US$607 million impact on the year, which was higher than the negative US$447 million reported in 2017. The following table shows 2018 production outcomes:

Source: South32 (ASX:S32)
Operationally, 2018 was not a standout year which was well reflected in the negative financial variance that was delivered. Generally, across the company’s operations it reported a number of mitigating factors, including falling grades and ore mined numbers as a result of scheduling, and planned and unplanned infrastructure shutdowns. Moreover, weather related events played a role as well, as did softer third-party demand.
Bright spots included record production at Australia Manganese (South32 interest 60%) that lifted group annual production by 9.2% compared to 2017, to 5.5 million wet tonnes. Australia Manganese delivered 3.4 million wet tonnes in 2018 which represents an increase of 13.4% on 2017. Driving the result was infrastructure delivering 107% of its design capacity. Mozal Aluminium (South32 interest 47.1%) also hit a record 271,000 tonnes of aluminium, for a rise of 0% compared to 2017 (the record is in the rounded numbers not shown). Again, the top-end of plant capacity had been tested.
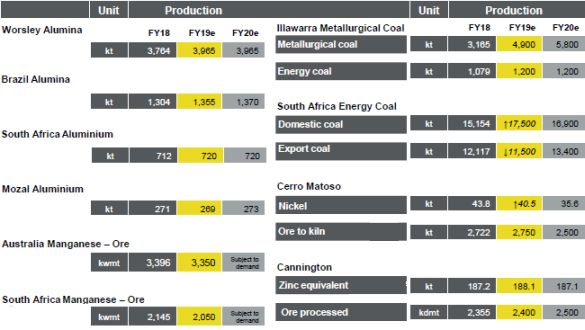
The company has provided production guidance for 2019 and 2020 which are show in the following table by individual operating units (S32 does not hold 100% of all of the units shown below):
Source: South32 (ASX:S32)
From the guidance numbers provided, we are of the view that operations may deliver a neutral to modestly negative financial variance in 2019, while 2020 could be modestly positive.
The company’s cost base did rise in 2018, as pressure across the broader resources sector remained in play.
On an adjusted basis for third party costs the full year 2018 base costs rose by 12.9% compared to 2018, to US$5.6 billion. The company reported higher price-link costs that added US$225 million and controllable costs of US$215 million. In passing inflation pressures added US$142 million to the cost base.
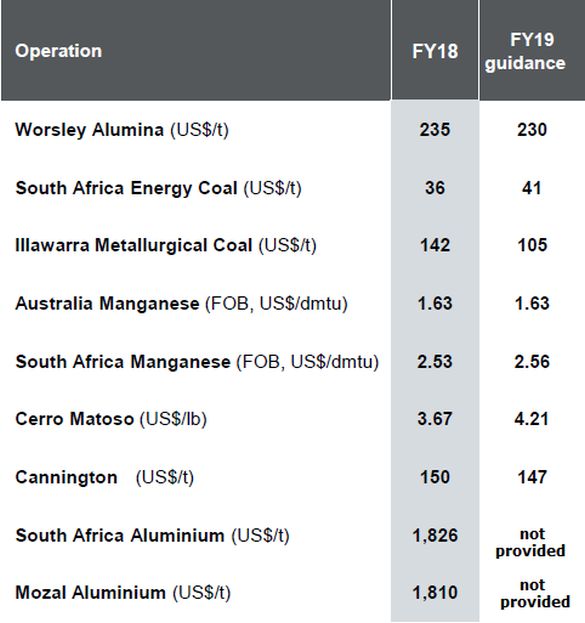
The major contributors to the price-linked result were US$84 million as a result of higher caustic process and US$86 million from smelter raw materials. Electricity charges added a further US$31 million in 2018. The following table shows 2019 guidance provided by the company for its operating units (FOB – free on board, dmtu – dry metric tonne unit):
Source: South32 (ASX:S32)
The negative 2018 cost variance is a turn from the positive contributions from the two years prior. While looking at 2019 guidance, there is no clear trend in the forecasts across the operating units. Once again costs could make a negative contribution to the 2019 financial result. The company is striving to return to a positive momentum in reducing the structural costs within its operations.
Net cash flow from operations fell in 2018, as operations delivered a mediocre result. The indicator fell 17.4% compared to 2017, to US$1.6 billion.
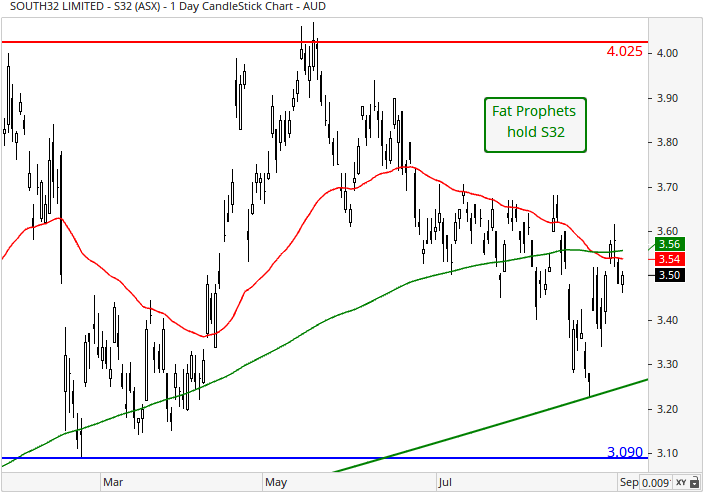
Turning to the daily chart, prices are currently in the midst of a zone of support indicated between $3.09 and $3.56. This is made up of the late-February low (horizontal blue line) and the 200-day moving average (green line) respectively. Overall, and in order for the short-term technical outlook to improve, a sustained break above the 50-day moving average (red line) of $3.54 is required. If this was to occur, then upward momentum would likely rise and a resumption of the medium-term uptrend is likely to follow.
South32 released the capital purse strings in 2018, with the reporting of a 30% increase in spending on 2017, to US$431 million. The following chart shows recent annual capital spending and the 2019 forecast (EAI – manganese equity accounted investments and IMC – Illawarra Metallurgical Coal):

Source: South32 (ASX:S32)
Of capital spending’s constituent parts in 2018, major project funding surged by 288% on 2017, to US$62 million and sustaining capital by 29% on the earlier year number, to US$431 million. Exploration expenditure for 2017 surged by 147% on the year earlier result, to US$40 million. We are pleased that the company has reversed the recent trend of curbing its capital spending, as we consider this spend, and especially exploration spending is the “life blood” of a resource company.
The company carried a net cash position at 30 June 2018 of US$2.0 billion, which compares favourably with the US$1.6 billion net cash position from a year earlier. Of net debts constituent parts, cash holdings rose by year-end while debt fell. Some US4295 million was added to cash over the year with debt fall by US$106 million. We have no concerns over the structure of the company’s balance sheet.
The Board declared both a higher ordinary dividend for 2018 and a special dividend. The company paid a final dividend of US6.2 cents per share fully franked to bring the fully dividend to US10.5 cents per share fully franked. The 2018 dividend compares favourably to the US10 cents per share fully franked dividend paid in 2017. On top of the final dividend the company declared a special dividend of US3 cents per share and franked to 81%. The company has completed a share buyback, cancelling 8.5 million shares for a cost of A$31.8 million in the last tranche. We are pleased with the company’s approach to rewarding its shareholders, as it reflects the Boards’ confidence in the financial position of the company. Further buyback activities would we believe be beneficial for current and future shareholders.
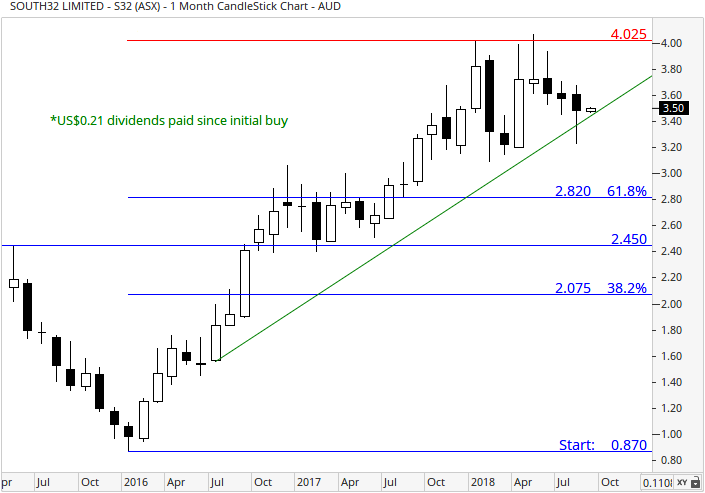
With reference to the monthly chart, prices have entered a corrective phase of the overall technical cycle after printing an all-time high of $4.03 in January. The upward sloping green line however continues to be respected. Should the bears maintain control over the near-term, then initial support is indicated $2.82, followed by $2.45. This consists of the 61.8% and the 38.2% Fibonacci retracements. In the grand scheme of things, the broader uptrend remains in play despite the softness in price-action that has been apparent of late. For this reason, we would categorise the recent period of weakness as both temporary and healthy.
We believe the assets held in the company’s portfolio have the capacity to generate future value. These assets have the requisite long-life and are positioned in the competitive part of the appropriate cost curves. This value proposition is further improved with the backing of a robust balance sheet and experienced resource/management team.
South32 has used its recent financial success to de risk its balance sheet and with that the mind set of investors around the quality of the company. The 2018 result from a commodity pricing perspective opens the way for a positive rerating of the company. Operationally, 2018 was not the company’s best performance.
With the company’s operational performance in mind, and events occurring in the broader global economy including trade frictions and sanctions; these events do warrant attention and may cause stress on equity markets in the future.
Consequently, and for the time being, we have changed our recommendation for South32 (ASX:S32) back to a hold.
Disclosure: South32 (ASX:S32) is held within the Fat Prophets Mining and Resources, Concentrated Australian Share and Concentrated UK Share managed account portfolios.

