
Fat Prophets take some profits
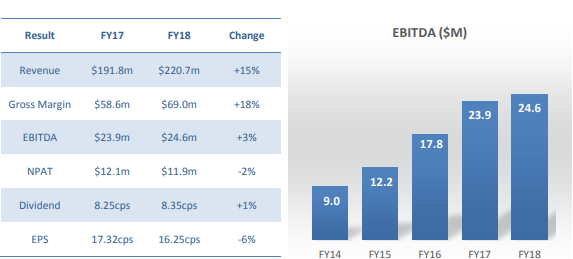
Leading VoIP (voice over internet protocol) provider, MNF Group (ASX:MNF) has released full year results, with another year of strong organic top-line growth with revenues rising 15% to $220.7 million. Earnings before interest, tax, depreciation, and amortisation rose by a more modest 3% to $24.6 million, due to a one-off investment into the Pennytel brand launch of $2.3 million.
Net profit after tax fell 1.7% to $11.9 million. This has disappointed the market, with the shares losing around 18% on the day of the announcement. We issued a mid-week alert on the same day recommending that Members hold the shares as we viewed the reaction as excessive. The shares have since recovered some ground and sit around 11% below the pre-results’ announcement levels. After further consideration we believe it is prudent to take some profits at this juncture.
We recommend Members sell half their holdings in MNF Group (ASX:MNF).
This represents a gain of around 325% on our original buy recommendation (excluding dividends). We will retain a holding in MNF Group for longer term exposure.
Full year results
MNF has been priced for growth for some time, and has over the years delivered on the promise, in spades. The full year result was a solid one in our view, but clearly not strong enough given the valuation metrics. We are therefore wary that there may be some ‘recalibration’ by the market in the months ahead, particularly with the shares still trading on around 32 times FY19 earnings.
At the top line the result was a good one, with FY18 revenues rising 15% to $220.7 million. Earnings before interest, tax, depreciation, and amortisation rose by a more modest 3% to $24.6 million, due to a one-off investment into the Pennytel brand launch of $2.3 million. This resulted in a final net profit after tax falling 2% to $11.9 million. The company increased the full year dividend by 1% to 8.35 cents per share fully franked, being a 51% pay-out ratio. Earnings per share declined 6% to 16.25 cents, with some dilutionary impact following the 2017 share placement and SPP.
Source: Company results announcement
While investors were expecting more upward action on the bottom line, underlying margins were still strong. The ‘gross margin’ (GM) rose 18% to $69.0 million. The company did however note that GM was slightly below expectations due to volatility in Global Wholesale revenues in H2.
The performance was nonetheless underpinned by strong growth across all segments. The company’s domestic retail business saw GM gain 15%, driven by strong demand from Enterprise and Government, as well as SME customers. The unit also enjoyed a full year’s contribution from the acquired CCI business.
Management expects further growth at the retail business as new technology continues to ‘disrupt voice communications’ and following the roll-out of the NBN. The company notes that the CCL acquisition is performing well with H2 margins up 10% while the Pennytel relaunch is yet to have a meaningful impact.

Source: Company results announcement
MNF’s Domestic Wholesale segment performed well with GM up 15% as well. The unit now has 300 wholesale customers, and around three quarters of GM are of a recurring nature. The total number of numbers hosted on the company’s Symbio network now stands at some 3.2 million.
In Global Wholesale, GM rose 17%, but with growth softening in the second half. Recurring margins stand at 42% but management expect this to increase in FY19. The company is seeing rising volumes on the back of increased capacity in Hong Kong and London. Overall, MNF estimates its market share is 2.7% of global volumes, with scope to increase this.
Looking at the balance sheet the picture is also very strong, with the company having no net debt at 30th June 2018. Cash balances stood at $18.9 million, with $8 million of planned capex for FY19. Management also openly talked about the prospect of further acquisitions to drive growth. We have full confidence in the ability of management to select and integrate new targets, having done so very capably over the years, and in so doing driven shareholder value. The company has of course already this year acquired SuperInternet Group in Singapore, which will provide a platform for further expansion in Asia.
Turning to the charts, and the technical picture has weakened. On the daily chart, prices have entered a corrective phase of the overall technical cycle after printing a high of $6.90 earlier in the year, as marked by the horizontal red line. On the plus side, after giving way, support has been reclaimed at the $4.89 region. Dynamic resistance at the 50-day moving average (red line) at $5.32 has however failed to hold.

With reference to the monthly chart, structural support was recently breached at the $5.03 region as shown by the horizontal blue dashed-line. In the grand scheme of things, a solid long-term uptrend remains intact as evident from the series of higher lows and higher highs since 2012. This however will need to be watched. Withstanding this, the probability exists for a retest and an eventual challenge of the February intra-month all-time high of $6.90 as illustrated by the horizontal red line, is likely at some point.

Summary
Leading VoIP provider, MNF Group (ASX:MNF) has released full year results, with another year of strong organic top-line growth with revenues rising 15% to $220.7 million. Net profit after tax fell 1.7% to $11.9 million which has disappointed the market.
The shares have regained some ground from their post announcement lows, but we believe it is prudent to take some profits at this juncture. MNF has been priced for growth for some time, and has over the years delivered on the promise, in spades. The full year result was a solid one in our view, but clearly not strong enough given the valuation metrics. We are therefore wary that there may be some ‘recalibration’ by the market in the months ahead, particularly with the shares still trading on around 32 times FY19 earnings. This is also consistent with a weaker technical picture emerging.
We recommend Members sell half their holdings in MNF Group (ASX:MNF).
This represents a gain of around 325% on our original buy recommendation. We will retain a holding in MNF Group (ASX:MNF) for longer term exposure.
Disclosure: MNF Group (ASX:MNF) is held in the Concentrated Australian Share and Small/Mid-Cap managed account portfolios.

