
Solid FY18
Evolution Mining (ASX:EVN) has followed up its cracker 2017 financial performance, with a solid result for 2018. The company reported a record underlying profit determined by a strong costs performance and a good underlying operational outcome, but partially offset by a lower realised gold price. Operating cash flow came in higher for FY18, allowing debt to be paid down for 2018 and a record dividend declared. The following table shows a summary of the 2018 financial result (EBITDA – earnings before interest depreciation amortisation, AIC- all in costs, cps – cents per share):
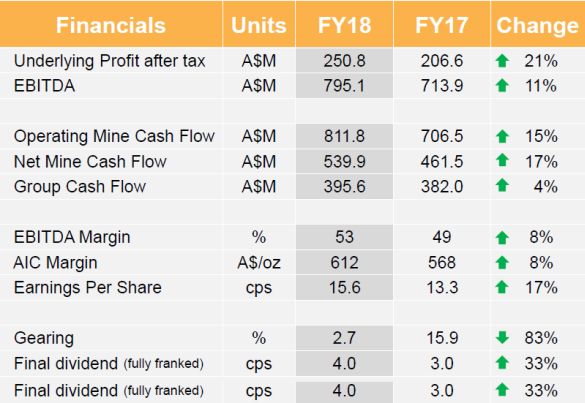
Source: Evolution Mining (ASX:EVN)
Overall, we consider the 2017 result to be a good one, with the company reporting some individual records for the year.
The bedding down of acquisitions and the sale of the Edna May mine have proven to be very value adding for the company and is paying off handsomely for shareholders.
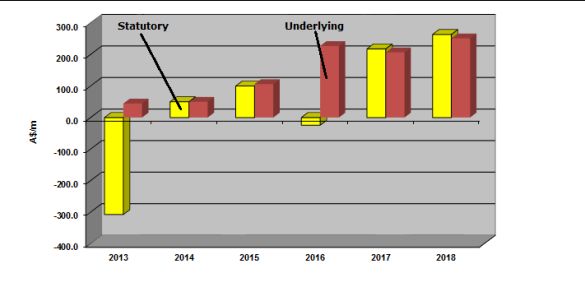
The company reported a record underlying net profit of A$250.8 million and a record statutory profit of A$263.4 million. On 2017, both Evolution’s underlying and statutory net profits increased by 21%. The following chart shows both annual underlying and statutory profits (A$/M):
Source: Evolution Mining (ASX:EVN)
Underlying profits better reflect the company’s ongoing businesses, with the improved 2018 result driven by a higher weighted average gold price and lower operating costs. Furthermore, the integration of all acquisitions did have a positive effect on the company’s financial result for 2018. Add a positive contribution from a higher, albeit modest, average gold prices and profit records fell for the year.
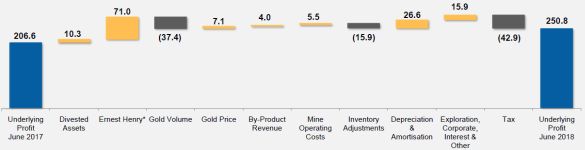
A number of factors contributed to the company’s profit performance for 2018, with these shown in the following waterfall chart (A$/M):
Source: Evolution Mining (ASX:EVN)
As Members can see from the above chart, the biggest contributor to the turnaround in 2018 was the improvement in operations at Ernst Henry and a full years’ contribution from the mine as well. Savings on mine operating costs pulled in A$5.5 million in savings over the year. Gold volumes was, however, a disappointment with a negative A$37.4 million contribution. Sale revenue for 2018 increased by a modest 4% compared to 2017, to A$1.5 billion, being driven by a higher average gold price.
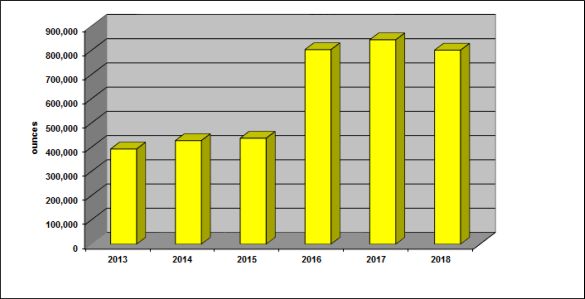
Operations delivered 801,187 ounces of gold in 2018, which represents a modest fall of 5.1% on the year earlier result. The following chart shows annual gold production:
Source: Evolution Mining (ASX:EVN)
Gold production for 2018 came in at the upper end of 2018 guidance, which was in the range of 790,000 to 805,000 ounces. The sale of the Edna May mine was a primary driver of the lower operational performance. On 2019 guidance, the company is forecasting gold production to be in the range of 720,000 to 770,000 ounces. The forecast step-down in production in 2019, reflects asset sales.
On the average realised gold price, the company reported an average realised sales price on spot gold sales totalling 592,1865 ounces at A$1,673 an ounce, representing a 0.4% rise on the 2017 result. Additionally, the company delivered 205,915 ounces of gold into its hedge book at an average realised price of A$1,564 an ounce. The company reported a 1.3% fall in the delivered hedge price compared to a year earlier. The company took a hair cut in delivering into its hedge book compared to the spot price.
Remaining to be delivered out to June 2020 is 250,000 ounces of gold at an average realised price of A$1,711 an ounce. With the Australian spot price for gold currently trading around A$1,624 an ounce, the average position of the hedge is ‘in-the-money’ and would have a positive effect on future sales revenue. We consider the hedge position as prudent given the volatility in the gold price.
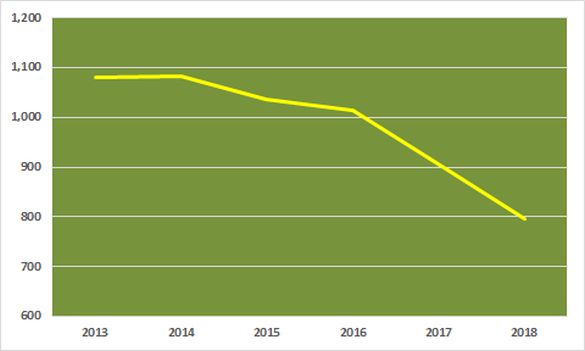
The improvement in all-in sustaining costs (AISC), delivered cost savings of A$15.9 million in 2018. The following chart shows AISC (A$/oz):
Source: Evolution Mining (ASX:EVN)
The trend is very pleasing, with the company delivering a 12.1% improvement in its AISC for 2018 compared to the year earlier result, to a record low of A$797 an ounce. The sale of Edna May, which was the company’s highest AISC operation helped to drive the result. Guidance for 2019 is for AISC to fall into the range of A$850 to A$900 an ounce.
Net mine cash flow was the beneficiary of the better financial performance with the reporting of a 15% rise on 2017, to a record A$706.5 million. The company expects to use this cash flow to sustain operations and fund major capital works.
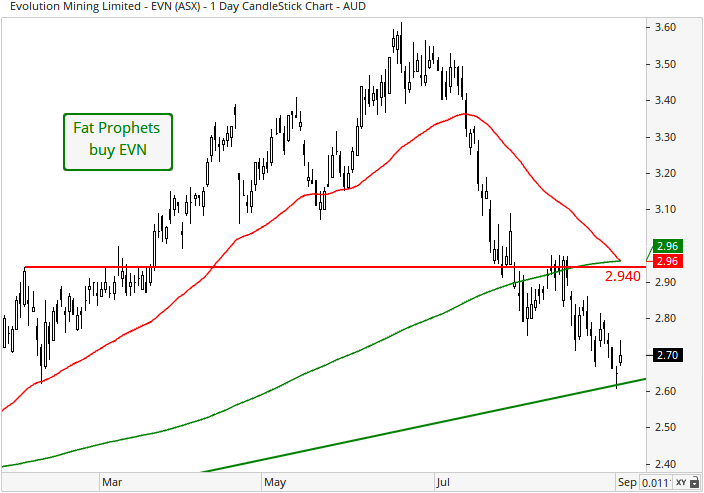
Turning to the daily chart, and after a strong run through to June, the share price of Evolution has corrected. Prices have broken support at the February intra-month high of $2.94 and the 50-day moving and 200-day moving averages. Prices have rotated up in recent days which is positive, but a successful challenge of the $2.94 level is needed to improve the picture.
The company continues to invest for the future, following an 11.0% increase in capital expenditure on 2017, to A$272 million for 2018. The company has been, with the acquisitions made in the past three years, steadily improving its development spend in line with a growing mine cash flow profile. Capital guidance for 2019 is expected to be in the range of A$255 million to A$315 million, of which A$150 million to A$180 million is ear-marked for major capital projects. Sustaining capital makes up the remainder and is forecast to be in the range of A$105 million to A$135 million.
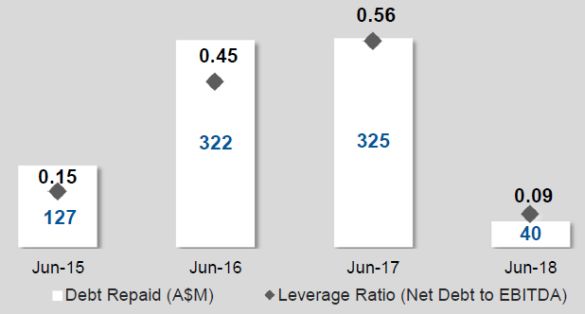
The balance sheet benefited from the better cash flow, to improve further from an already robust position. The company’s net debt position at 30 June 2018 stood at A$62.7 million, which compares very favourably with the A$391.9 million from a year earlier. The following chart shows recent debt repayments and leverage ratio:
Source: Evolution Mining (ASX:EVN)
As Members can see the company has focussed its recent efforts on repaying debt, and has been successful at doing so. The repayments have seen the company’s gearing on a net debt to net debt plus equity basis fall to 2.7% at 30 June 2018, representing a reduction of 83% from 30 June 2017. The company has all but extinguished the debt associated with all the acquisitions made during 2016/17, and as such, we have no concerns over the company’s balance sheet.
The other beneficiary from the better financial performance for the year was the 2018 dividend. A final fully franked dividend of A4.0 cents was declared compared to the A3.0 cents declared for 2017. The increase reflects the confidence the Directors have in the ability of the company’s assets to sustain future dividends.
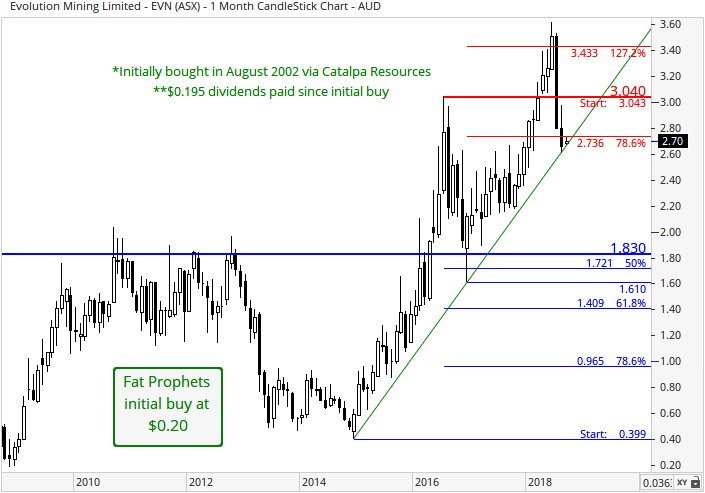
With reference to the monthly chart, a cluster of support was respected between $1.72 and $1.83. This is made up of the 50% Fibonacci retracement (blue set of retracements) and the October 2010, September 2011 and October 2012 resistance (horizontal dashed-blue line) respectively. In addition, a ‘bullish doji’ candlestick pattern formed as of the close of trading in December 2016, which is a sign of positive sentiment to arise over the medium-term. From a broader perspective, prices are flirting (on a monthly-basis) with the 78.6% Fibonacci retracement of $2.74 (red set of retracements). This will need to be watched. Prices have corrected from their 2018 highs but long-term momentum is favoured to the upside, with an upward sloping trend-line (in green) still evident.
We continue to believe that Evolution Mining (ASX:EVN) is well positioned to navigate through the turbulent gold price environment of recent months. During the past three years, the company has successfully integrated a number of major acquisitions that have positively impacted the company’s financial position. A focus on optimising operating costs, operations and capital in that time has paid dividends in the current full year result and the preceding one. We continue to hold to the view that Evolution Mining is well positioned to generate future shareholder value.
Consequently, Evolution Mining (ASX:EVN) is recommended, as a high conviction buy for Members with no exposure to the stock.
Disclosure: Evolution Mining (ASX:EVN) is held within the Fat Prophets Concentrated Australian Share, Mining & Resources and Small & Mid Cap managed account portfolios and The Fat Prophets Global Contrarian Fund.

