
Record Finish
Financial Service Platform, Praemium (ASX:PPS) recently reported Fiscal Year 2018 results which show the company has ended the year on solid footing having registered another record level of inflows. The company also saw growth across all regions and looks set to maintain the momentum following the completion of several key initiatives. In light of the strong results and positive outlook going forward, we rate the shares back to a BUY rating.
What’s New?
In our last coverage of the stock back in July (FAT-AUS-882), the company announced its 4Q quarterly trading update which showcased the tremendous growth achieved to date, with quarterly fund inflows the third highest on record, and the best ever annual effort.
This, likewise, caused the company’s shares to reach a 52-week high of $1.07. That didn’t last long as a much larger rival, BT Financial Group (BTFG), which is the wealth management arm of Westpac Banking Corporation (ASX.WBC), announced a “price cut” which led to other players in the sector such as HUB24 (ASX.HUB), Netwealth (ASX.NWL), and Praemium itself, coming under significant pressure as the market was concerned about the impact on growth and on margins.
As noted in our report on peers HUB24 and Fiducian, we dispelled such concerns, with the headline price cuts not representative of the overall picture, and likely to have a smaller impact than expected. The concerns eventually ‘rationalised’ in this direction, with the shares bouncing back.
Since then, Praemium has released Fiscal Year 2018 (FY18) results ended 30 June 2018 which will be the main focus of today’s report. Admittedly, this results period does not include the impact of rival BTFG’s move though we will nevertheless keep a close eye on proceedings, and the Fund Inflows in the next quarterly report (July – September) due out in early October.
Without further ado, the FY18 Results:
FY18 Results Review
Starting from the top, the company reported annual inflows for FY18 reached a record $3 billion and up 50% year-on-year with Domestic Inflows rose 69% year-on-year to $2.2 billion and International Inflows were up 13% to $0.8 billion.
The graphic below showcases the company’s inflows over the last five years and includes Funds Under Administration (FUA) over the same time period:

Source: Praemium (ASX:PPS) 13 August 2018 Company Presentation
With such strong Inflows FUA has risen to $8.3 billion, up some 35% on a year ago.
Split up on a regional basis, FUA in Australia now totals $5.6 billion while International FUA now totals $2.7 billion and is up 20% over the past year.
Going forward, the outlook for the platform looks positive and set for further sustained growth with the Domestic business seeing another mandate secured at the start of the new financial year (FY19). Hartleys, a leading wealth management firm, signed up to the company’s reporting and administration software for managing portfolios from July 2018.
Prior to that was a big contract win having onboarded Morgan Stanley Australia in June. This is a sizeable win for the company considering that Morgan Stanley’s Wealth Management business has circa $27 billion in assets under management (AUM) across 110 advisers.
On the international front, the outlook for inflows also look positive as the company completed regulatory initiatives, such as MiFID II and GDPR regulations to capture relevant European and other compliant international players. The company has also secured authority to operate in Dubai to build up a beachhead in the Middle East.
Revenues for FY18 increased 22% year-on-year to $43.2 million. Referencing the reports, there was growth across all product lines, but continued strength in the Separately Managed Accounts (SMA) platform was the standout, with revenues up 41% year-on-year to $24.3 million on strong funds inflow and higher margins from the in-house investment management unit. This also compares well against the modest growth in Portfolio services (+4% yoy) and Planning Software (+5%). The graphic below illustrates the performance:

Source: Praemium (ASX:PPS) 13 August 2018 Company Presentation
Looking at revenue contributions across regions and starting with Australia, record inflows in the SMA platform greatly contributed to growth turnover rising 41%. Portfolio Services record a more modest 4% increase over the same period and as a result of a much larger FUA base. As such, domestic revenues for FY18 were up 19% to $27.6 million.
Looking towards international operations, in the UK, expanded 27% year-on-year to $14.9 million as both revenues streams (SMA platform and Investment Management income) benefitted from strong inflows. Funds under administration (FUA) were up 20% year-on-year to $2.7.
Asia revenues went up 36% year-on-year to $700 due to growth in recurring WealthCraft (CRM and Financial Planning Product) licenses.
Moving on to the cost side, operating expenses for FY18 at the group level came in at $34.34 million up, 18.2% year-on-year. A closer look shows that this was largely driven by the growth in FUA which saw commission cost surge 77% year-on-year to $4.6 million as well as in sales & marketing expenses (+31.6% yoy) to $7.5 million. The graphic below provides a look across regional segments:

Source: Praemium (ASX:PPS) 13 August 2018 Company Presentation
Turning to the EBITDA line, Australia continues to carry the loss-making international operations having brought in $12.4 million, up 17% year-on-year. Despite the ongoing losses (due to smaller scale), EBITDA in international operations is getting closer to breakeven with management expecting profitability within FY19, especially from the UK.
In Asia, with the testing phase of the Hong Kong-based customer relationship management project completed, EBITDA loss decreased by 14% year-on-year to $1.0 million. Going forward, management noted that profitability in Asia is set to improve significantly with the reduction of the R&D cost base and recurring licence revenues expected to support profitability.
Overall, EBITDA margins at the group level also considerably improved, up to 20.4% compared to last year’s 17.8%. EBITDA at the group level came in 39.7% higher year-on-year to $8.8 million.
The graphic below summarises other metrics for the FY18:

Source: Praemium (ASX:PPS) 13 August 2018 Company Presentation
Consequently, from all the improvements noted above, consolidated NPAT for the FY18 has more than doubled (+123.4% yoy) from $688,269 to $1,414,541. Overall, we are pleased with the company’s trading performance and effects of operating leverage which has been the theme of our investment stance.
Moving on to the balance sheet, the company remains debt free with a net asset position of $20.3 million and with a cash hoard of $12.1 million (+34.9% yoy) as at 30 June 2018 which increased significantly on the back of its scaling up and greater profitability.
Also, another key highlight in our view is that operating cashflow increased from $1.54 million to $5.4 million (+251.8%) as a result of the EBITDA growth. This implies that Praemium (ASX:PPS) can fund more of its growth internally going forward.
Going forward, managements notes that they expect continued growth in the SMA business with more institutional and advisor accounts adopting this platform technology. That said, management has launched a mix of products and services from International Portfolio Models to Digital Account Opening and a Pension Platform for UK to maintain momentum in this arena. We also expect the regulatory compliance (MiFID II & GDPR) will contribute to contract wins from Europe.
Turning to the technical outlook, and on the daily chart, prices have broken above the 50-day moving average (red line) of $0.89 as dynamic resistance. This is a positive event, which swings short-term momentum in favour of the bull-camp. Overhead resistance sighted at the January high here has also been taken out. The overall picture is positive, backed by the bullish moving average crossover present since August 2017. This occurs, when the 50-day moving average (red line) crosses above the 200-day moving average (green line). Resistance at the July high of $1.07 is now in focus.

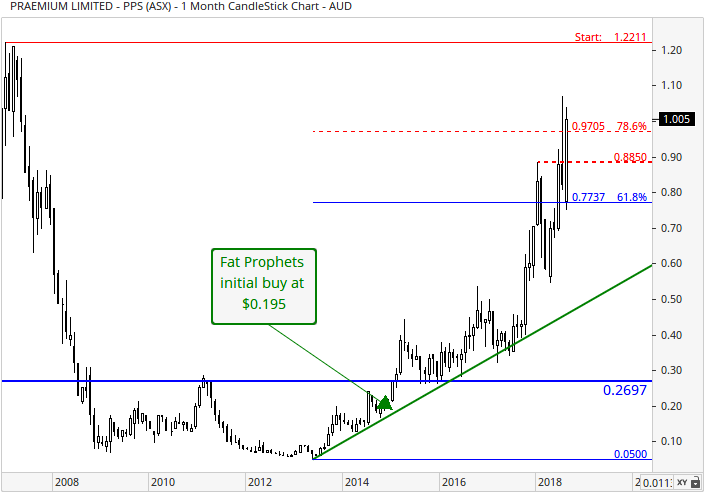
With reference to the monthly chart, structural support was respected at the $0.27 region (horizontal blue line) in late 2015, and coupled with dynamic support being respected at the long-term uptrend line (upward sloping green line), has led to a stern upward trajectory in the share price. The 61.8% Fibonacci retracement at $0.77 has been breached, as has that at the 78.6% Fibonacci retracement at $0.97. The all-time high of $1.22 has now become a more realistic target from a technical perspective.
Summary
Praemium (ASX:PPS) had another year of record performance marking continued growth across all regions and business units proving our expectations for an impressive FY18 finish. That said and going forward, we expect further growth in the bottom-line as international operations are reaching a critical mass and set to deliver profits (or at least breakeven) within FY19.
On a valuation front, the shares are currently trading on a FY19 earnings multiple of 52.7 times, falling to 36.7 times in FY20. These are admittedly lofty metrics, but the company’s scale is growing at a rapid clip and a high degree of operating leverage has the potential to deliver substantial shareholder gains over the medium to longer term.
In light of the strong results, constructive technical action, and a robust outlook, we are moving the shares back to a BUY rating for Members without exposure, We stress that the shares can be volatile and a medium to longer-term view needs to be adopted. Members are reminded that the company’s shares are thinly traded, so patience should be exercised when building a position.
Disclosure: Praemium (ASX:PPS) is held within the Fat Prophets Concentrated Australian Share and Small/Mid-Cap Models. The Praemium platform is also used by Fat Prophets Wealth Management.

