
Underlying Growth
Property site Domain Holdings Australia (ASX:DHG) recently delivered its first results since the demerger, showcasing top line growth on the back of strength in the digital space and despite headwinds from a softer property market. Management’s efforts to control costs have also underpinned margin strength. With the group set to benefit further from the combination of Nine with Fairfax, we maintain our BUY rating.
What’s New?
At end of July (FAT-AUS-884) we focussed our update on the proposed merger between Fairfax Media and Nine Entertainment. There we noted the benefits to be gained with Domain likely to see considerable upside through the increased audience reach and marketing power of a scaled up majority shareholder. We thus upgraded our view on the company to a BUY rating.
Since then, the company has issued its Fiscal Year 2018 (FY18) results which is its first since the demerger, and will be the main focus of today’s report. But prior to that, we want to remind Members that Jason Pellegrino, the former head of Google Australia, will begin his role as the Managing Director and CEO of Domain next week, 27 August 2018. We believe he has just the credentials to guide Domain, as it seeks further growth, and looks to gain ground on larger competitor REA.
Now without further ado, the company’s results:
FY18 Results Review
Note to Members: results are Pro Forma which provides a view of what the financials should look like if the company had been separately listed for the full financial year.
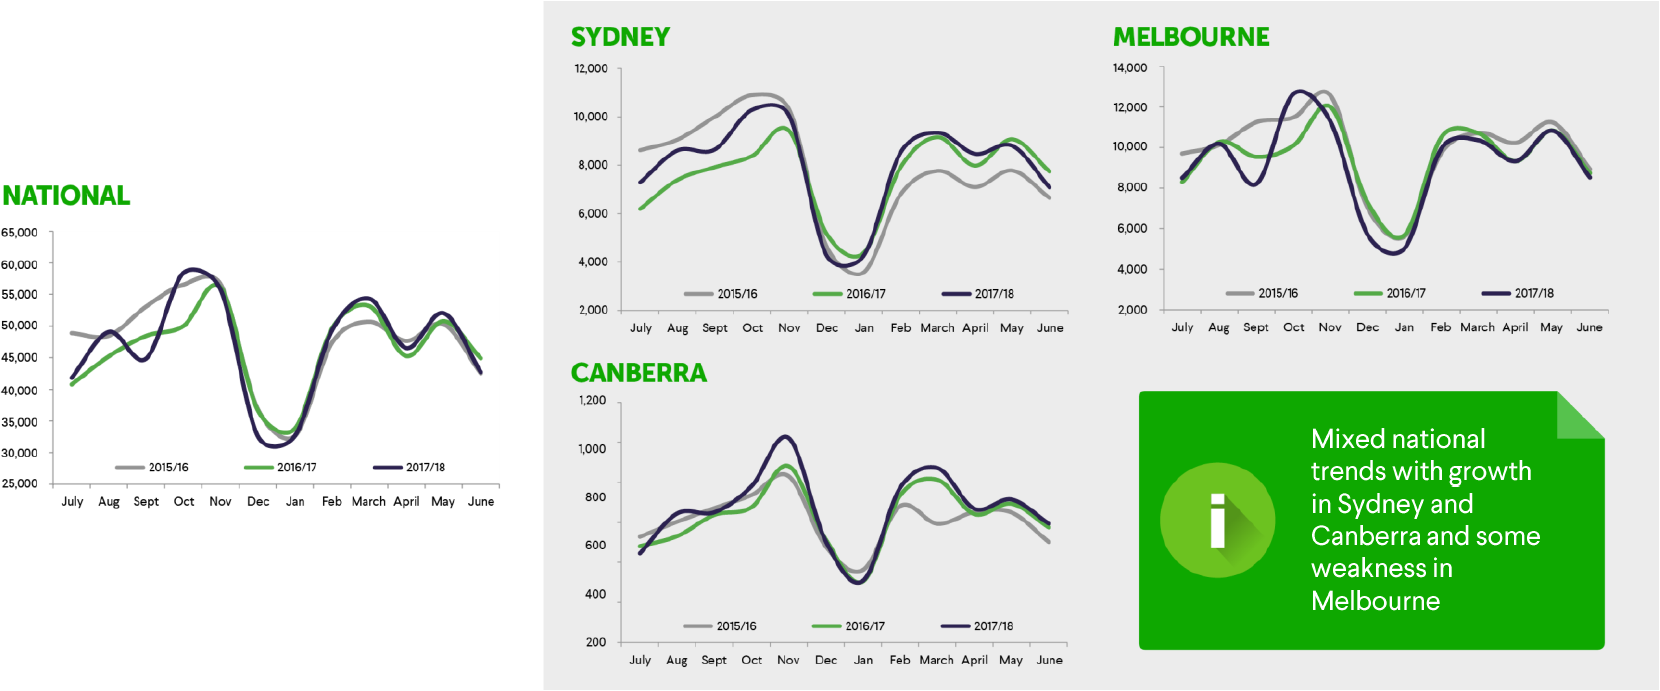
Australia’s property market has been coming off from all-time highs, led by drops in Sydney and Melbourne. This comes as a consequence of tightening credit and a softer market. This has pressured the company’s results with listings trending lower across the country as shown in the graphic below:
Source: 13 August 2018 Company Presentation
Despite that, revenues, according to Chairman Nick Falloon, were supported by “yield increases and higher depth product penetration” – another way of saying raising prices and focussing on higher margin premium ads, has offset the lower level of listings. Other business segments continued to deliver decent growth with the only decline coming from the Print business which is facing a secular downtrend for the sector. That said, Revenues for FY18 expanded at a double-digit pace of 11.5% year-on-year to $357.3 million.
Management has provided additional commentary that they will continue to combat the softer liftings by continuing to raise prices and increasing the product focus towards more premium ads. That aside, management are aiming to also grow other businesses, such as the Domain Loan Finder (brokerage), Compare & Connect (utilities comparison) and building, house, landlord and car insurance business Domain Insure.
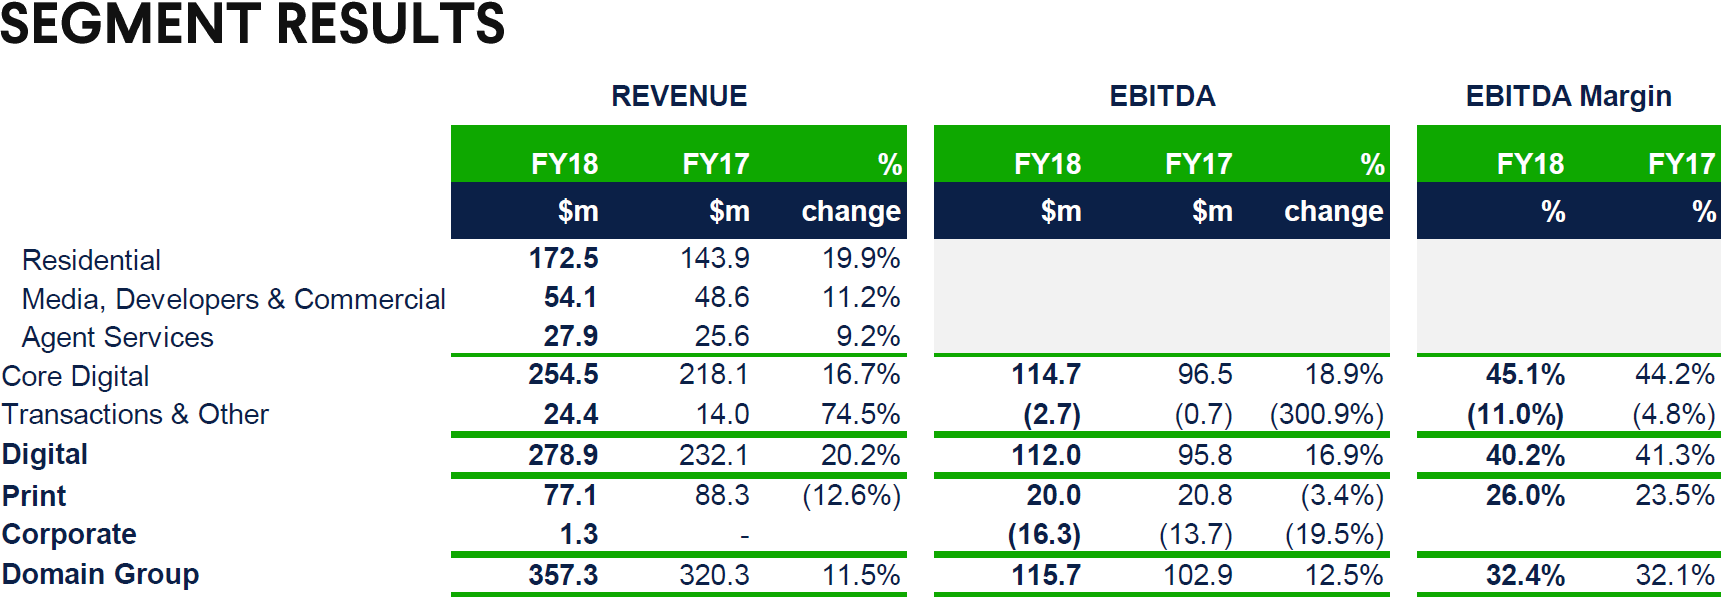
The graphic below shows Pro Forma segment results for the FY18:
Source: 13 August 2018 Company Presentation
Moving on to a segment breakdown and the Core Digital business (comprised of Residential; Media, Developers & Commercial; and Agent Services) continued to exhibit growth in FY18 with revenues up 16.7% year-on-year to $254.5 million.
Residential performance aside, the Media, Developers and Commercial segment saw a challenging environment in the year with the Media unit reporting headwinds due to large rivals such as Facebook and Google competing heavily for the same ad space. The company has responded to challenges with a fully programmatic advertising offering to rely more on algorithms and leverage on big data.
The other unit (Developers & Commercial) had a much stronger result with market share gains and increased listings, opposite of Residential, resulting in higher growth with Developers’ listings up 41% year-on-year and Commercial up 37% year-on-year. The entire segment delivered a decent 11.2% year-on-year increase to $54.1 million.
The Agent Services segment also saw increased subscriber growth as more property professionals sought to utilise the company’s CRM (Customer Relationship Management) software, MyDesktop. This resulted in revenues increasing by 9.2% year-on-year.
Overall EBITDA for the Core Digital group continues its growth pace, up 18.9% year-on-year to $114.7 million while margins inched up 90 basis points to 45.1% due to a favourable product mix.
Transactions & Other revenue grew 74.5% year-on-year to $24.4 million and reflected strong growth from Compare & Connect, early revenue from Domain Loan Finder (launched in July 2017), and Domain Insure which was launched in January 2018. Going forward, we expect this segment to increase its profit contribution down the line as it scales up.
Print as noted above continues to face headwinds as the sector shifts towards the Digital space. Management’s focus here is to sell towards the aspirational and lifestyle audiences which have higher discretionary spending. That aside, management is focused on reducing costs and this is reflected in the improving EBITDA margins (26.0% vs 23.5%).
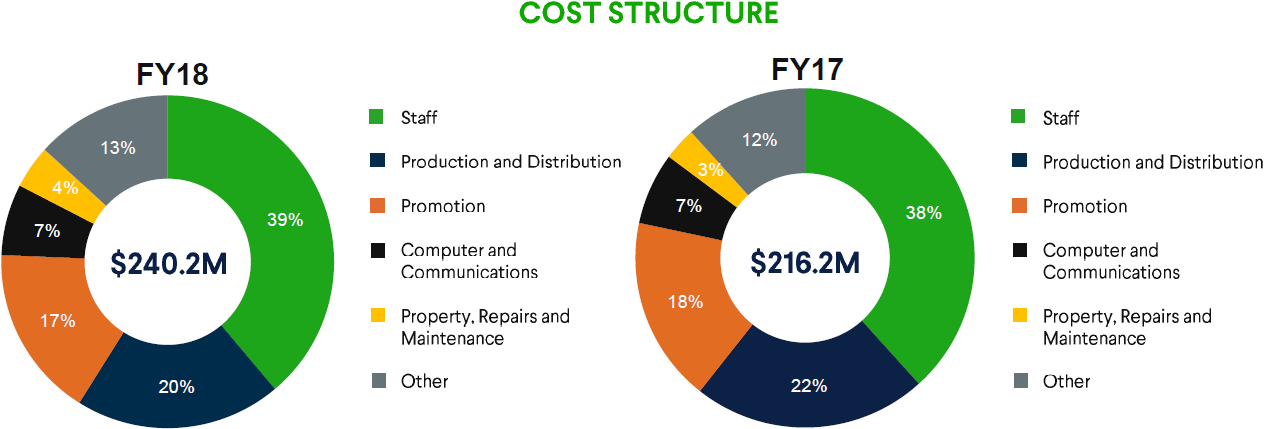
Moving on, Group level expenses for the FY18 increased 11.1% year-on-year to $240.2 million as the company continues to increase investment in the Transactions business as well as seeing higher staff costs. Despite the increase, management’s efforts to rein in costs resulted in a better than expected outcome as guidance initially pegged expenses to rise between 12% and 13%. The graphic below showcases the split across various sources:
Source: 13 August 2018 Company Presentation
Moving on down to the bottom-line, though, the company reported a FY18 statutory net loss after tax of $6.2 million. A closer look though shows that this was the result of a $29.6 million write down from “significant items” and includes costs related to the re-branding of The Weekly Review print titles to Domain Review, costing the company a non-cash restructuring charge of $6.4 million.
Other costs include the company’s decision to exit from its 50% stake in Beevo – a small company which connects utilities for SME’s, as well as a $12.3 million write-down of Oneflare – an online marketplace for trades like electricians and plumbers to list services.
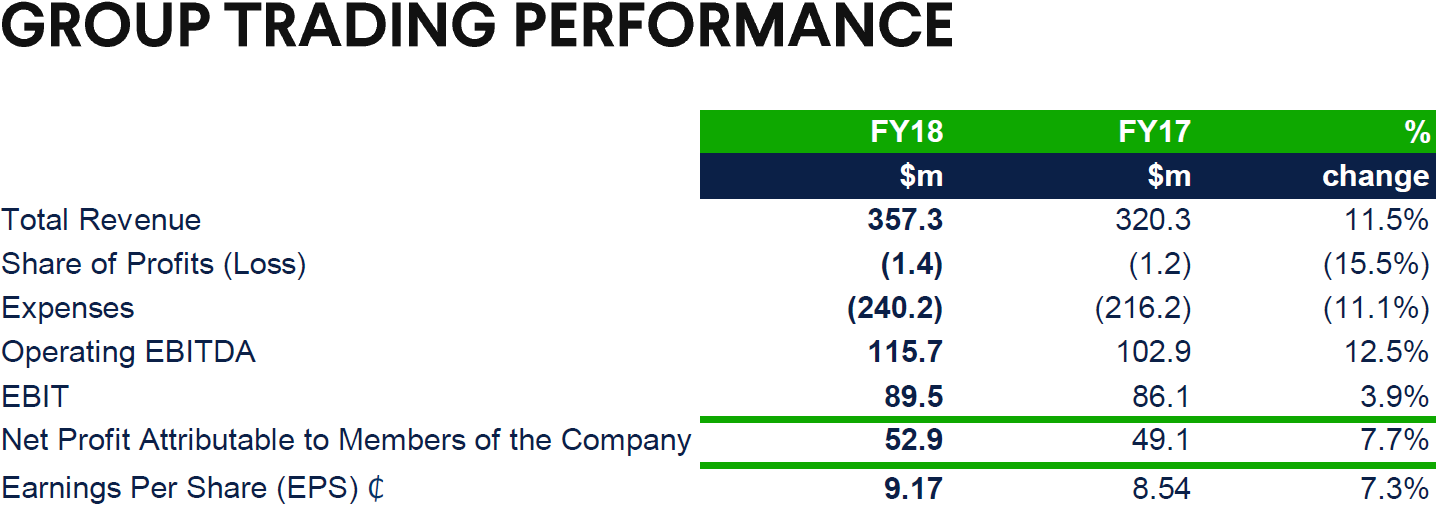
Note though that this isn’t entirely representative of the underlying results and adjusting out “significant items” and other tax charges, the company’s underlying net profit for FY18 is 7.7% higher year-on-year to $52.9 million with EPS at A9.17 cents and up a similar 7.3% pace. The graphic below summarises group level performance:
Source: 13 August 2018 Company Presentation
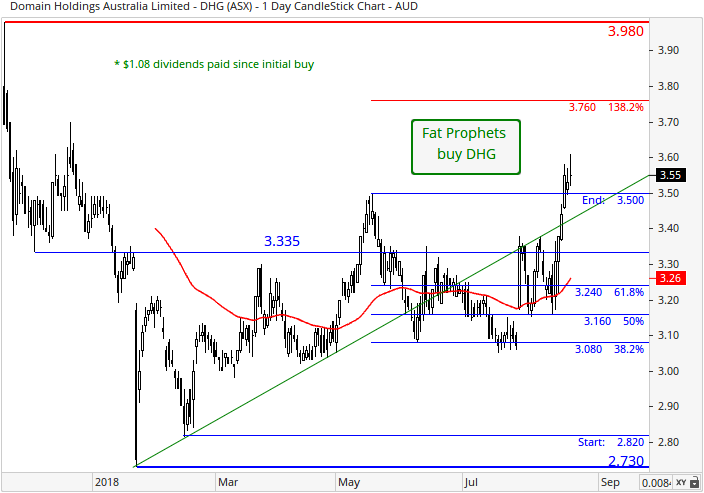
Turning to the chart of Domain, recent results, and the takeover of Fairfax, have seen prices push firmly up from the early 2018 lows. Prices have retaken dynamic support at the 50-day moving average around $3.26, in addition to that provided by the 61.8% Fibonacci retracement at $3.24, which is a positive development. A more recent move back above prior support provided by the upward sloping green line has further strengthened the technical outlook.
Summary
Overall, Domain’s underlying FY18 result were decent, marking growth year-on-year as revenues across non-legacy (print) businesses delivered market share gains. That aside, management has also kept costs well under control leading to an expansion in the bottom-line.
Over the longer term, we expect further gains in the Digital space, while there is also much more on offer in our view as Domain makes market share inroads, and targets underpenetrated regions. We also see significant synergistic benefits accruing from having the support of a more scaled up majority shareholder as the combination of Nine and Fairfax goes through.
Domain is trading at 33.4 times for FY19 and we don’t view this multiple as “stretched” given the digital growth prospects, and the prospective backing of a majority shareholder with even more scale, more than justify this rating.
We retain a buy recommendation on Domain Holdings Australia (ASX:DHG) for Members without exposure.
Disclosure: Fairfax Media and Domain Holdings Australia (ASX:DHG) are held in the Fat Prophets Global Contrarian Fund (ASX: FPC). Both companies are also held in the Fat Prophets Concentrated Australian and Small/Mid-cap managed account portfolios.

