
Results in the Bag
Following a robust performance in the first half of the year (1H18), Orora (ASX:ORA) ended the fiscal year on a strong footing with productivity improvements in the domestic business offsetting the headwinds felt in the North America business. In light of that, we maintain our BUY rating on the stock.
What’s New?
In our previous coverage of the stock back in June (FAT-AUS-877), we focussed mainly on the company’s Strategy Update and a brief review of the Interim Results. A notable development in the update was the company’s efforts to increase competitiveness in the North America (NA) market via using cutting edge technology to ramp up efficiencies from the boosts in productivity along with cost-out initiatives.
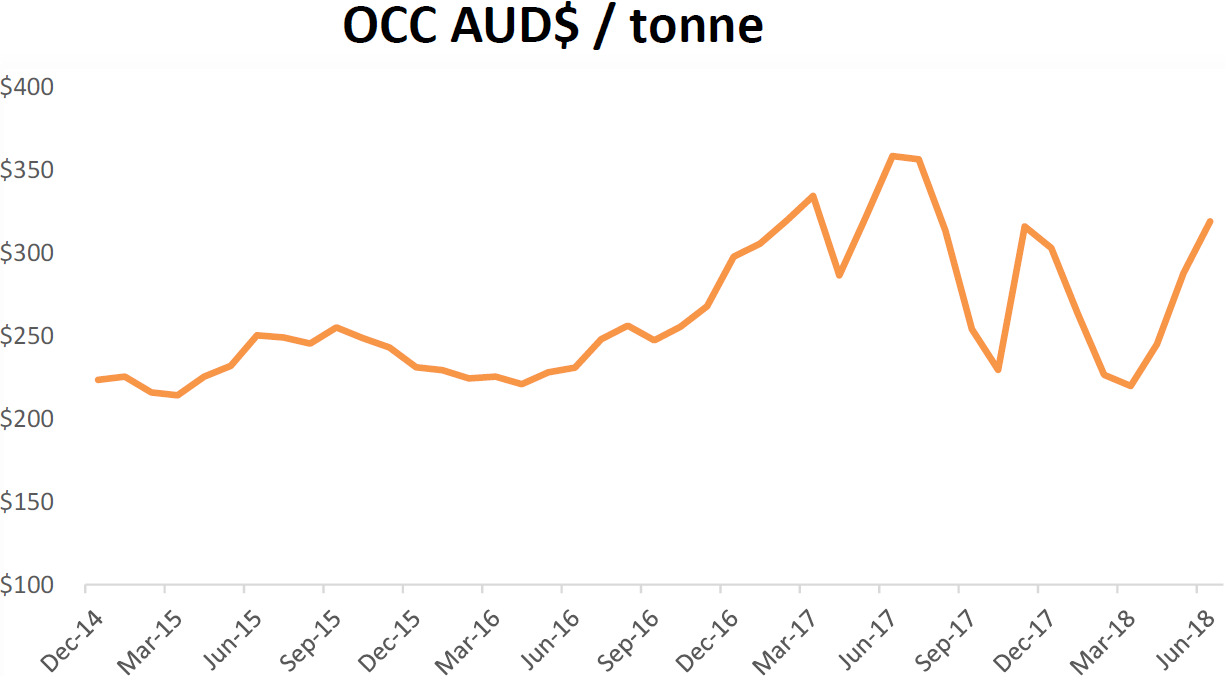
These achievements are notable considering the OCC (old corrugated containers) price headwinds from China initiatives.
The graphic shows the OCC (in AU$) prices:
Source: 09 August 2018 FY18 Presentation
We also like that the company has made efforts to reduce volatility (as reflected in the chart) with its hedging efforts. Recently, the company noted that it has renewed a number of fixed price contracts covering 90% of its supply to reduce the EBIT impact.
An interesting development to monitor, in our view, is the recent action by the Chinese Ministry of Commerce early this month when it issued new tariffs on $60 billion in imports from the USA including OCC which will be hit with a 25% tariff scheduled to take effect next week, 23 August 2018. This marks the first time recovered paper and plastic has been targeted directly.
Following the strategy update, the company released its Fiscal Year 2018 (FY18) Results last week which will be the focus of today’s report:
FY18 Results Review – Currency in A$ unless otherwise noted
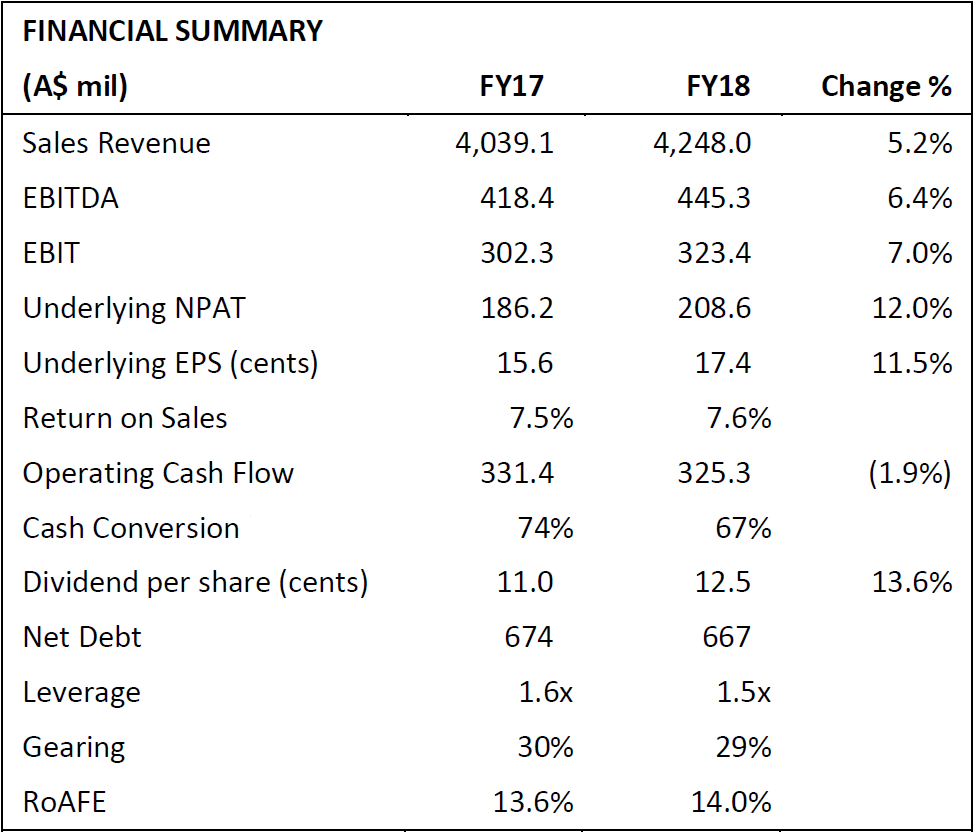
Starting from the top and FY18 revenues for Orora (ASX:ORA) came in 5.2% higher year-on-year to $4.25 billion with both regional segments (AUS & NA) delivering organic growth while NA saw an incremental benefit from successfully integrating Orora Visual (formerly IntegraColor). Unfavourable currency translation in the NA business had an adverse impact though.
Going forward, management notes that they intend to focus on a mix of growth initiatives, with the domestic operations set to grow from both organic investments in Fibre and Beverage businesses and some bolt-on acquisitions. The NA business splits the growth strategy into two with Orora Visual focussing on ramping up production to meet growing demand while the Packaging business will pursue a mixed M&A and customer acquisition strategy.
The graphic below summarises key financial metrics:
Source: 09 August 2018 FY18 Filing
Looking at segment performance from a profitability perspective and the Australasia business delivered standout results having benefitted mostly from organic investments and cost efficiencies.
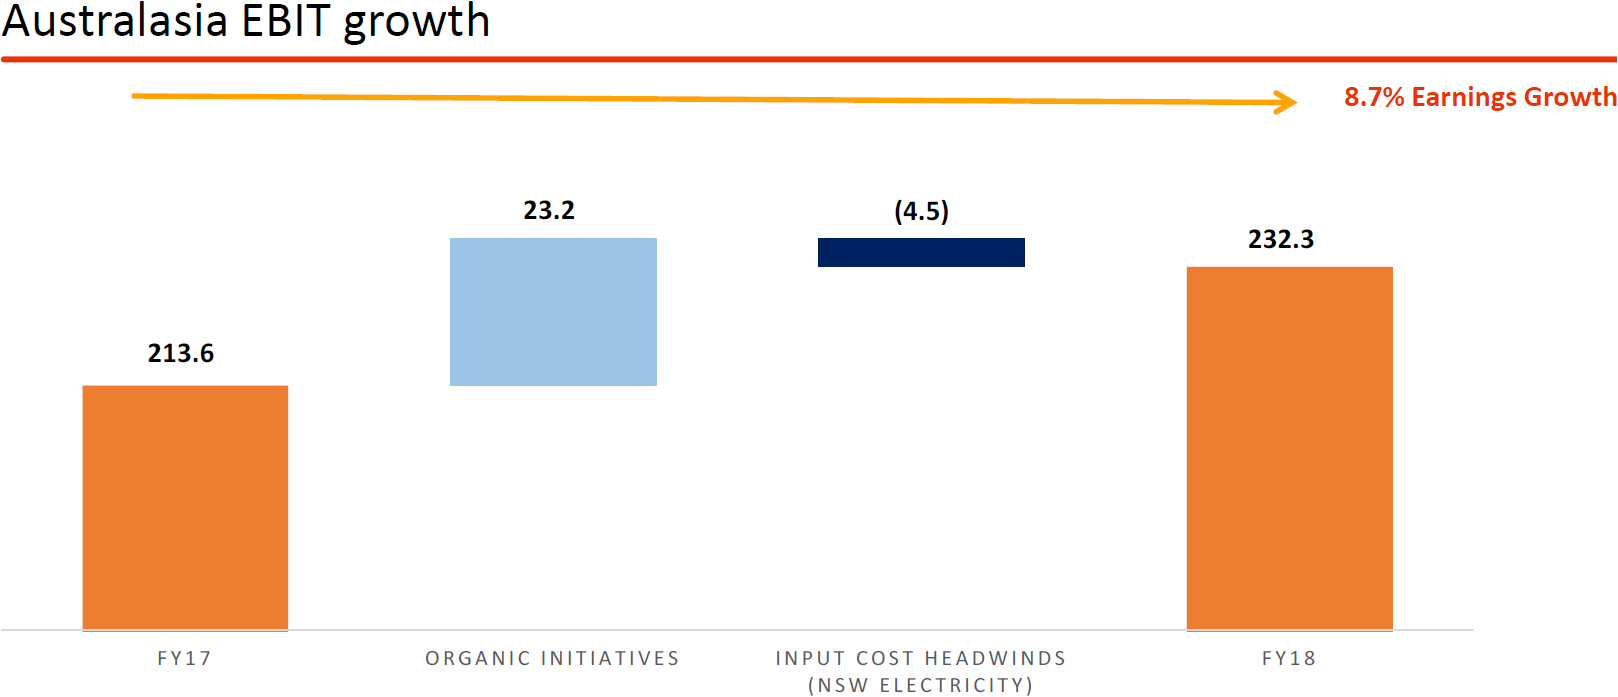
As shown in the waterfall chart below, EBIT in this division rose by 8.7% year-on-year to $232.2 million from $213.6 million:
Source: 09 August 2018 FY18 Presentation
The company’s efforts to reduce overhead expenses via long-term renewable contracts (~10 yrs) hedging energy costs as well as the successful commissioning of the $23 million Waste Water Treatment Plant have paid off. The company’s investments towards increasing capacity via ramping up production and efficiency (Fibre Refresh) and the Glass Warehouse Expansion have also improved operational profitability.
These, combined, led to a $23.2 million positive contribution in EBIT while the Input Cost Headwinds in the NSW operations dragged down the result by $4.5 million. However, as noted above, the long-term contracts will reduce the overall impact on rising energy costs going forward as the hedges were implemented in January 2018.
Combined, the company’s EBIT margins hit a record 11%. Going forward, we expect continued margin expansion on the back of further efficiency gains.
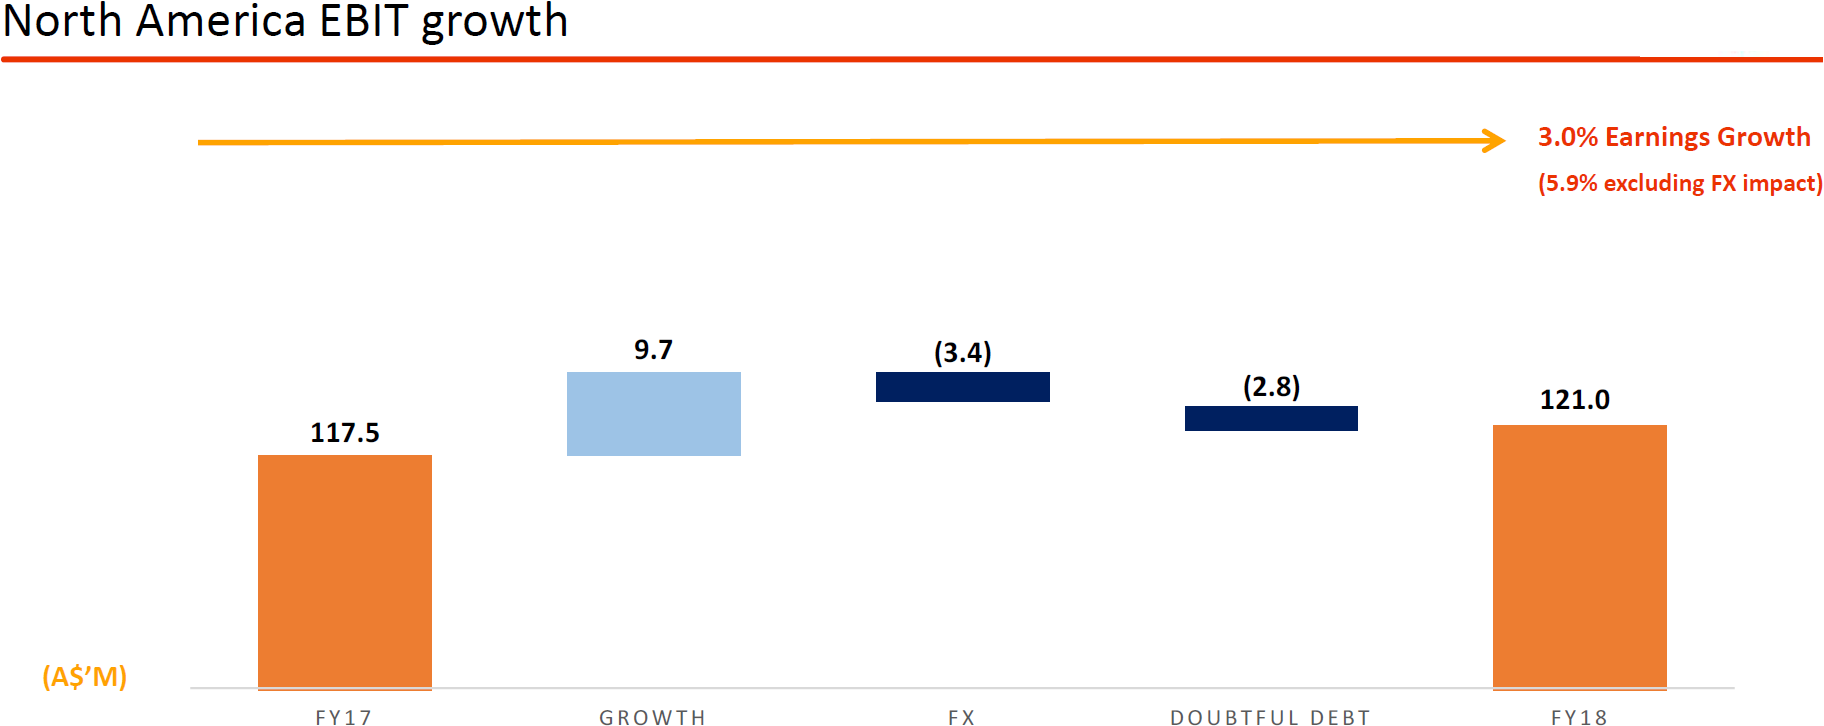
Moving on to the North America business and the segment saw a negative impact mainly from three sources, firstly the unfavourable currency movements which detracted from EBIT by $3.4 million. This was followed by transitional costs related towards the implementation of the Enterprise Resource Planning (ERP) Software System at Orora Packaging Solutions business. Finally, another detractor was the liquidation of Toys ‘R’ Us which adversely affected the Orora Visual business by $2.2 million (~$600k remainder from various sources).
On the other hand, steady business wins across both main business lines and cost out efforts have resulted in a positive $9.7 million impact and as reflected in the graphic below, show EBIT year-on-year growth of 3% to $121 million:
Source: 09 August 2018 FY18 Presentation
Margin wise, the significant increase in debt provisions (Toys ‘R’ Us bankruptcy) and ERP transitional costs saw a 30-basis point downtick for EBIT Margins to 5.6%. Nevertheless, the sales growth and efficiency improvements paid off and put this result ahead of both the 5-year average of 5.2% and sector average of 5.12%.
Corporate costs, on the other hand, saw a 3.8% year-on-year increase to $29.9 million with a large part coming from 1H18 costs when the company undertook feasibility studies of NA growth options, partly offset by lower Depreciation and Amortisation costs of $700,000.
Combined, Group level EBIT for year came in at $323.4 million, up 7.0% year-on-year and broadly inline with consensus estimates of $326 million. From an underlying perspective, the key driver of FY18 EBIT were the productivity gains and organic growth from domestic operations. The year-on-year improvement in domestic operations was more than enough to pull up EBIT margins and improve it by circa 13 basis points from 7.48% to 7.61%.
Ultimately, Statutory NPAT came in higher, up a substantial 24% year-on-year to $212.2 million though this includes a one-off gain of $31.6 million from the sale of the Smithfield Site which we covered in the interim results. Adjusting for one-offs, there was a 7.9% year-on-year improvement of $180.6 million.
Going forward, we remain optimistic in management’s ability to expand the bottomline with their initiatives to raise efficiency. That said, we note that compared to previous years, the company has been relatively quiet on acquisitions with only 2 minor bolt-on acquisitions to date – a specialist corrugated box converter and a distributor of consumable packaging in 1H18 – for the domestic Fibre business.
That said, and with the ERP set to complete by January 2019, we expect management attention towards resuming M&A activities. The company retains a very robust balance sheet with a substantial undrawn bank capacity ($175 million upon short notice) and manageable leverage as shown in the graphic below:
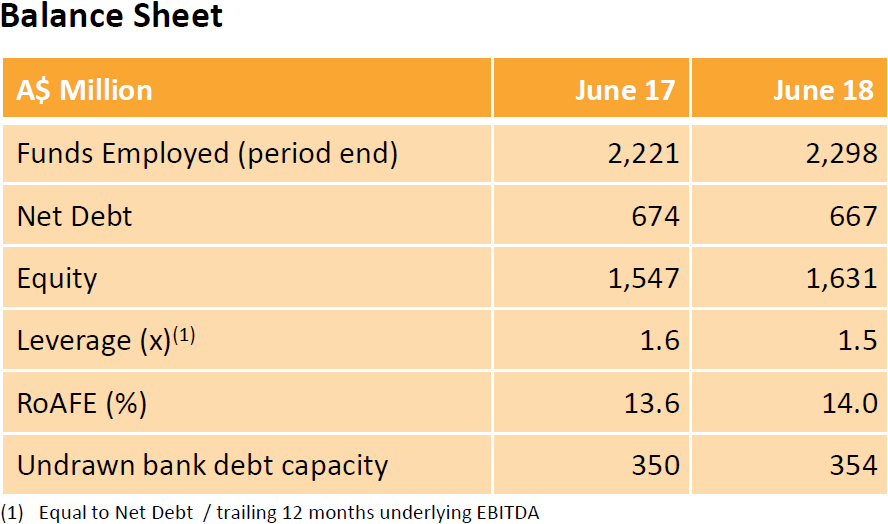
Source: 09 August 2018 FY18 Presentation
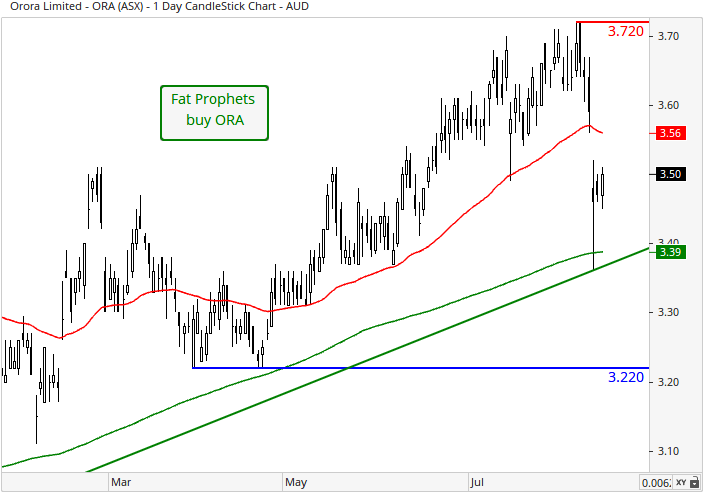
Turning to the daily chart, overhead resistance situated at the November intra-month high of $3.43 has been surpassed. Medium-term momentum remains in favour of the bulls, as backed by the bullish moving average crossover present since August. This is when the 50-day moving average (red line) crosses above the 200-day moving average (green line). Resistance at the all-time high of $3.72 stood firm this month, but the upward sloping green trend-line remains as a support as does the 200-day moving average. A move back above the 50-day moving average would be positive.
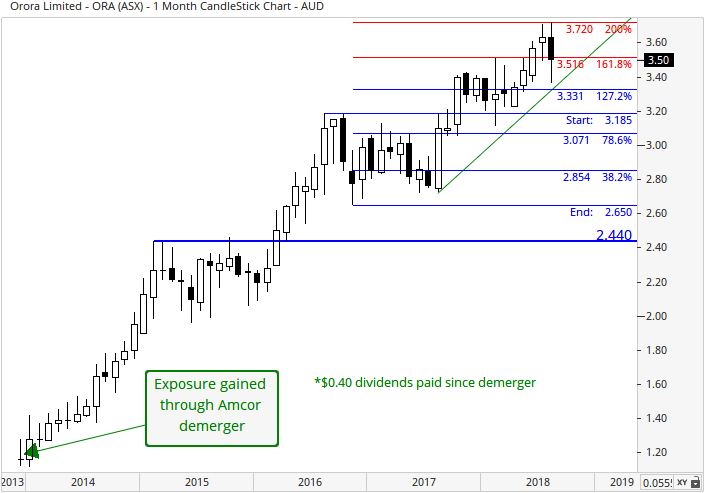
With reference to the monthly chart, prices have closed (on a monthly-basis) above the 78.6% Fibonacci retracement of $3.07 (red set of retracements). This is a positive event and activated two additional upside targets. The initial target of $3.33 being the 127.2% Fibonacci extension has since been achieved, which now leaves the 161.8% Fibonacci extension of $3.52 as the next focal point of resistance. This is currently being tested. Overall, the long-term uptrend remains firmly intact.
Summary
We continue to view Orora (ASX:ORA) as a high-quality, defensive business. While Orora encountered several headwinds in FY18, we think management are doing a good job under the circumstances. Headwinds may continue into FY19, but with the ERP rollout at OPS nearing completion and plenty of balance sheet capacity for organic growth investments or M&A, we believe the medium-term earnings outlook remains solid.
Orora (ASX:ORA) shares trade on approximately 21.0 times FY19 earnings estimates, falling to 18.9 times the following year, with a partially franked forecast dividend yield of 3.5% increasing to 3.8% over the same time frame.
Orora (ASX:ORA) will remain held in the Fat Prophets portfolio. We recommend the stock as a Buy around current prices for Members without exposure.
Disclosure: Orora (ASX:ORA) is held with the Fat Prophets Concentrated Australasian Share and Small & Mid-Cap Models.

