
Still gaining altitude
Qantas Airways (ASX:QAN) shares have continued to gain altitude since our last coverage. The third quarter trading update provided further confirmation of the success of its turnaround efforts in recent years and a general improvement in market conditions, setting it up for a record year of underlying profits despite a rise in fuel costs. An on-market share buyback program supports the investment case.
Fuel costs – the State of Play

Source: Platts, Oanda
Although there has been a recent dip, fuel costs have been on the ascent since multi-year lows in late 2015 / early 2016. As with most airlines, Qantas (ASX:QAN) has hedges in place over the short-term. In the 1H18 results, the airline said it expected its fuel cost bill to be around $3.24 billion for the full year, with 81% hedged for the remainder of FY18. The expected FY19 fuel bill was 50% hedged.
Later, at the time of its third quarter trading update the airline said at the end of April 2018, hedges were in place for approximately 70% of its expected fuel costs for FY19. Even with the hedges, the airline was expecting higher fuel costs to crimp full year FY18 profits by around $200 million, Qantas was on track for a record underlying full year pre-tax profit in the range of $1.55 billion to $1.60 billion.
Ongoing transformation benefits, as well as capacity and revenue management are expected to help mitigate the impact of higher fuel costs that all airlines are dealing with.
Chairman Succession
In late June Qantas announced that its current Chairman Leigh Clifford will step down from the Chairman role at the national carrier in October this year, after 11 years in the role. Current Board member, Richard Goyder, will assume the role following the company’s AGM on 26 October.
Mr Clifford stated: “It has been an absolute privilege to lead the Qantas Board for these past 11 years. The national carrier has never been in a stronger position and that’s a credit to the management team and the 30,000 employees that make up the Qantas Group family,” and added, “Richard is one of the most experienced business leaders in Australia and an excellent choice to lead the Qantas Board into the future.”
Mr Goyder is well regarded in Australian business circles and joined the Qantas Board in November 2017 after serving as CEO of Wesfarmers for 12 years. Other Board roles include being Chairman of Woodside Petroleum and the Australian Football League.
Mr Goyder said: “Qantas is an iconic Australian company and one of the best performing airline groups in the world. I’m honoured to be named its Chairman and look forward to working with my Board colleagues to help it take advantage of the opportunities ahead.”
Importantly, we have continued confidence in Qantas CEO Alan Joyce, who has overseen an impressive turnaround effort at Qantas in recent years.
This has included a string of asset sales, with another announced in April 2018. The transaction involved selling its catering business to Emirates’ catering subsidiary, dnata (Dubai National Air Transport Association).
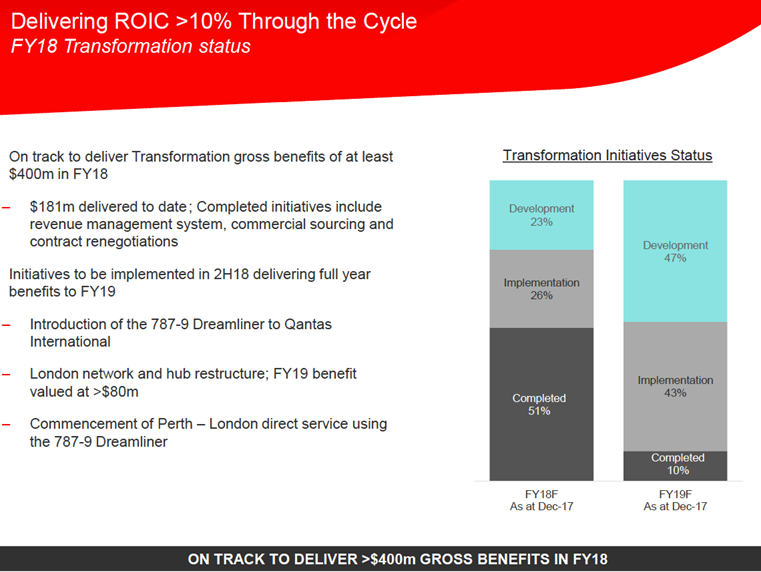
In the 1H18 results, Qantas said it was on track to deliver transformation gross benefits of $400 million in FY18, with $181 million in the bag. The following graphic from the presentation ‘slide deck’ shows the second half initiatives to be implemented.
Source: Qantas (ASX:QAN)
Recent results from Qantas highlight the improvement in profitability:
In February of this year Qantas announced an on-market share buyback of up to $378 million and reported a record first half profit. Moreover, underlying profits before tax was up roughly 15% to $976 million. Gains were driven by the Australian operations, with domestic underlying EBIT (earnings before interest and tax) up 20% to $447 million, as the load (seat) factor ticked up 1.4 percentage points to 78.7%. Unit revenue increased 8.6% and the operating margin lifted 1.9 percentage points to 14.6%.

Source: Qantas (ASX:QAN)
It was interesting to note recently that Aviation Industry analysts OAG reportedly identified Qantas’s Melbourne-Sydney route as one of the most profitable in the world, surpassed only by British Airways’ New York to London route.
The Melbourne-Sydney route combines high traffic numbers with a relatively high proportion of business customers, who tend to book later and pay more for their flights.
In the 1H18 results, the International segment posted a 5.5% decline in underlying EBIT to $222 million, but Dreamliner aircraft (more fuel efficient) and new network structure are expected to deliver benefits in FY19. On that note, as we noted in our prior coverage of Qantas, the airline received the greenlight from the ACCC for its alliance with Emirates announced in August last year. The decision was made to extend the partnership for five years. As we stated then, we believe this will continue to support Qantas’ International division from FY19 onwards as new routes open, such as the Perth-London route as well as the switch from Dubai to Singapore as the hub for Qantas’ second London service.
Looking briefly at other aspects of the Qantas first half and Jetstar Group saw underlying EBIT increase 15.6% to $318 million. The LCC (low cost carrier) is growing its network into Bali, Vietnam and China and its territories. The load factor increased 2.4 percentage points to 85.7% and unit revenue was up 7%. Although it’s a competitive area, there is significant scope for growth in the Asian region. The airline said its Asian airlines portfolio was profitable in the period.
In 1H18 the Qantas Loyalty segment saw EBIT creep up 1.7% to $184 million, even as the operating margin declined by 30 basis points to 24.1%. The company said growth its co-branded credit cards are outpacing the market.
The strong overall interim report was followed up with a positive third quarter trading update in May.
At that time group revenue for 9M18 was up 7.5% year-on-year to $4.25 billion.
Revenue for the quarter benefitted from the timing of Easter which mostly took place in the 3Q period and pushed demand for leisure travel compared to the prior corresponding period. Group Unit Revenue – a measure that combines the fares paid and the percentage of seats filled – increased 6% year-on-year.

Source: 03 May 2018 Company Presentation – Macquarie Conference
Group Domestic (including both Qantas and Jetstar brands)
Unit Revenue increased by 8% compared to the prior corresponding period. That reflected solid demand across key markets, supported by some increased corporate travel due to the continued recovery of the resources sector and market share gains from the small-to-medium enterprise segment. This segment also benefitted from reduced capacity and price hikes.
Group International (Qantas International, Jetstar International and Jetstar Asia)
On the other hand, reported a slightly slower Unit Revenue growth of 5.2%. Still, we viewed this as a decent result given intense competition.
The company outlined its expectations for a record underlying full year pre-tax profit in the range of $1.55 billion to $1.60 billion.
That implies an increase of between 10.7% and 14.3% year-on-year at the bottom and top end of the range respectively.
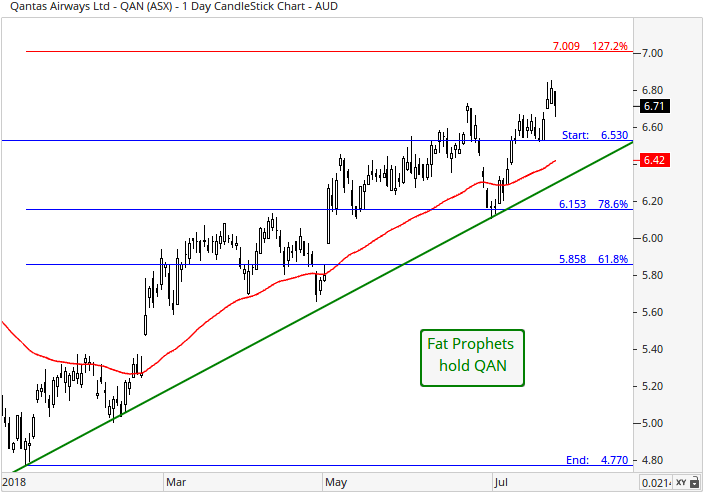
Turning to the charts, and on the daily, the underlying impulsive move north remains firmly intact. In the grand scheme of things, prices have cleared both the 50 (red line) and 200 day moving averages, which is suggestive of momentum to have swung north. An eventual upward rotation towards resistance located at the October 2017 high of $6.53 has also occurred as we suggested previously. The 127.2% Fib retracement around $7 is now in sight.

With reference to the monthly chart, support was respected at the 38.2% Fibonacci retracement of $5.02 (blue set of retracements) in January, which is deemed positive price-action. Our previous theory that a resumption of the broader uptrend would likely follow has since played out, with resistance at $6.00 surpassed. Resistance sighted at the October 2017 high of $6.53 has also given way. A definitive clearance of this level now likely yields a longer-term advance towards the 127.2% Fibonacci extension of $7.45. This price level was triggered when prices closed (on a monthly-basis) above the 78.6% Fibonacci retracement of $4.97 in May 2017 (red set of retracements).
Summary
Qantas shares (ASX:QAN) are trading around 12.4 times FY19 forecast earnings. The shares have performed impressively since we backed the turnaround story in August 2014. Although the lowest hanging fruit has been plucked given the upward movement, the story is a good one. Although there are a couple of caveats, such as risks from higher fuel prices and pilot shortages over the medium-term, we like the direction management is steering the airline. Both the interim 1H18 numbers and the third quarter trading update in our view suggest it is worth staying strapped in for now.
Accordingly, Qantas (ASX:QAN) will remain held in the Fat Prophets Portfolio.

