
Proving up the south
With an understanding of what to look for from exploring the northern Yamarna Belt, Gold Road Resources (ASX:GOR) has had its first success since regaining a full interest in the southern Yamarna Belt. Since returning to the south, the company has been focussed on the Smokebush and Wanderrie gold camps. The first drill programmes by the company at both camps did intersect high-grade gold. In the meantime, the Gruyere development (Gold Road’s interest 50%) progresses toward commercial production. The following figure shows the location of the company’s total tenements over the Yamarna Belt (Smokebush and Wanderrie are highlighted):
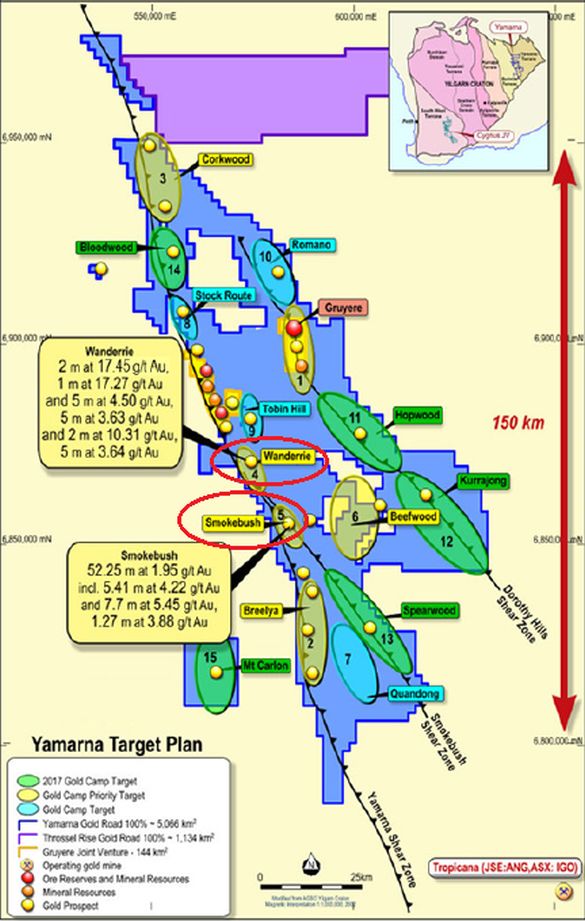
Source: Gold Road Resources (ASX:GOR)
The company focussed on both the Smokebush and Wanderrie camps as these two sites are close to the company’s Gruyere development. Moreover and importantly, earlier drilling had detected the presences of gold at both sites.
At Smokebush, earlier drilling success at the Yalffler prospect had detected the presences of gold, with assays returning 13 metres graded at 0.54 grams per tonne (g/t) gold from 142 metres with a sweet zone of two metres graded at 2.10g/t gold from 152 metres and a second drill intersection of 13 metres graded at 0.45g/t gold from 226 metres with a sweet zone of two metres graded at 1.88g/t gold from 227 metres. The company’s recent drill programme was designed to follow-up on these very good results.
Not to be left behind, earlier drilling at the Wanderrie camp confirmed the presences of gold. At the Satriani prospect, the better mineralised intersections include two metres graded at 14.74g/t gold from 73 metres. The Santana prospect returned multiple intersections of one metre graded at 17.73g/t gold from 68 metres and five metres graded at 2.03g/t gold from 108 metres. A third prospect in Gilmore showed three metres graded at 2.03g/t gold from 114 metres. The company’s recent drill programme was designed to follow-up on these very good results.
On the Gruyere progress, the company indicated that overall engineering and construction were 84% and 44% respectively complete, while the process plant and associated infrastructure construction was 17% complete. The following figure shows an image of the Gruyere project site:
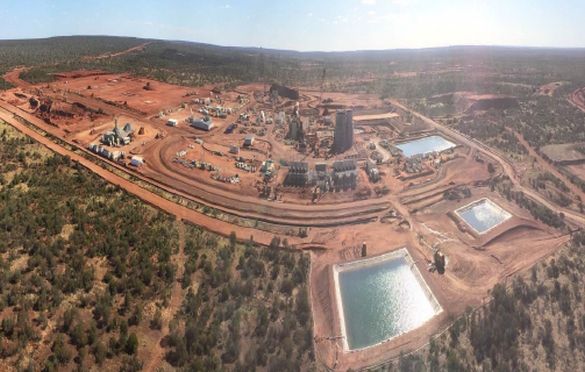
Source: Gold Road Resources (ASX:GOR)
Unfortunately, abnormal weather has caused the cost to slip, with the estimate to completion now forecast to be toward the upper end of the range of A$506 million to A$585 million.
The cost estimate does include a A$30 million contingency. Additional allowances have been made for potential further wet weather events impacting on the site.
The weather has not only required a cost adjustment to be made but has also pushed the schedule back. Completion is now expected in June 2019, rather than original forecast of March 2019.
Such events are unfortunate, but the Gruyere project given the cost uplift and additional time-on, continues to show robust returns.
The company indicated that the natural gas pipe to the site and construction of the power station are progressing well. This infrastructure is being built by third parties.
We retain a positive outlook on the gold price for the year-end 31 December 2018 and expect the price to be in the range of US$1,550 to US$1,600 an ounce.
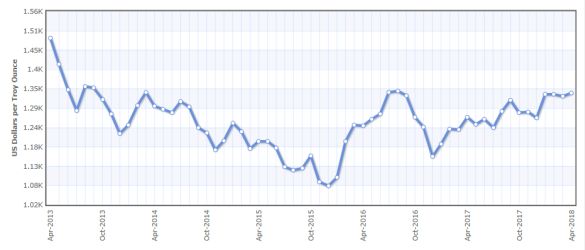
The following chart shows the gold price:
Source: Index mundi
Expectations of higher inflation in the latter part of 2018 and going into 2019 will be a key tailwind for the gold price. An accommodating US Dollar on the gradualist approach by the US Federal Reserve and rising competitive currencies against the US Dollar will also push the gold price. Furthermore, the “safe haven” characteristic of gold cannot be ignored given the state of global events. At the time of writing, the gold price was trading around US$1,292 an ounce.
To shield revenue, the company has entered into a forward sales hedge with 70,000 ounces of gold covered for an average price of US$1,720 an ounce. Based on the above US Dollar price for gold, the Australian Dollar price is currently A$1,730 an ounce, the position would be a drag on revenue. Despite our positive view on the gold price, we consider the position to be prudent.

Turning to the charts, and on the daily, prices have entered a corrective phase of the overall technical cycle after printing a recent high of $0.8450 in January. A layer of support is currently being tested to the downside between $0.745 and $0.75. Some consolidation would however be healthy because it forms part of a broader uptrend. Furthermore, and from a macro perspective, medium-term upward momentum remains in play, and therefore would likely steer the broader direction of Gold Road Resources (ASX:GOR) share price.
We believe the substantial funding the company has and the funding behind the joint venture, will allow the company to fully explore the Yamarna belt. With future production now assured, as the Gruyere deposit advances firmly toward commercial production, there may be considerably more for the Yamarna belt to reveal. Importantly, the company has the funds to now get out and give the whole of the Yamarna Belt a real exploration work over.
At 31 March 2018, the company had a cash resource of A$224 million and carried no debt. With the cash resources at hand and a newly established financing facility of A$150 million, the company has the resources to complete the construction of Gruyere and conduct an extensive exploration programme. We have no concerns over the company’s liquidity.
The successful return to the southern portion of the Yamarna Belt is a real value add event, as Sumitomo walking away from the joint venture may have deflated investor interest in the region. We believe this will now not be the case, given the successful return drilling results.
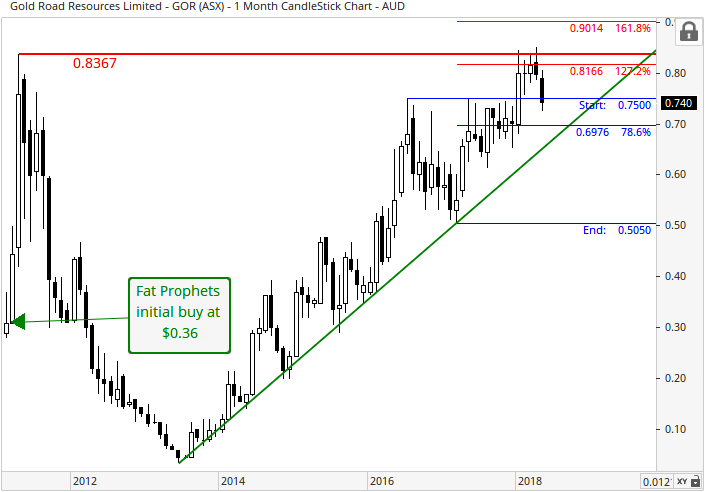
With reference to the monthly chart, support was respected at the long-term uptrend line (upward sloping green line) of $0.50 in March 2017. This is a positive development, and has since resulted in a resumption of the uptrend in place since 2014. Looking forward, the long-term technical outlook has strengthened, due to the share price closing (on a monthly-basis) above the 78.6% Fibonacci retracement of $0.70 in August 2017. This is a bullish development and now activates two additional upside targets. The initial target of $0.82, being the 127.2% Fibonacci extension has been achieved, but prices have backed away. The 161.8% Fibonacci extension of $0.90 also stands as a focal point of resistance. Overall, the long-term uptrend remains firmly intact, as evident from the series of higher lows and higher highs in formation since 2013. Consequently, this would likely translate to further gains over the broader time horizon.
Duplicating this success at Wadderin and Lake Grace are both potential blue sky future shareholder value-add opportunities. With Gruyere progressing toward commercial production and with a full cash chest to continue with what has been a successful explore programme deep de-risking is close at hand.
Consequently, we continue to recommendation Gold Road Resources (ASX:GOR) as a buy for Members who do not have exposure to the stock.
Disclosure: Gold Road Resources (ASX:GOR) is held within the Fat Prophets Mining and Resources portfolio.

