
Changing with the Times
National Australia Bank’s (ASX:NAB) first half cash earnings were hit by restructuring charges and an investment in technology to whittle down the bank’s future structural cost base. Management also flagged that the bank will pursue the sale of the MLC wealth business, following the trend of other peers to divest non-core assets.
Financial advice businesses have been in the headlights – and not in a good way – due to revelations from the Royal Commission review of the industry, but the review of the fate of the business within NAB began before that and was speculated on by investors much earlier.
NAB’s strategic moves are part of its simplification process, announced in November 2017. CEO Andrew Thorburn said at a briefing with reporters that “We need to simplify the bank. Complexity in the bank is just killing us”.
With first half fiscal 2018 pro-forma cash earnings of $102 million, total assets under management of approximately $199 billion and a significant market share of the domestic superannuation market, the business is likely to fetch a $3 billion or more valuation. NAB said they are considering a “broad range of exit options,” which will include a demerger and IPO or a trade sale.
While this is part of the simplification process, NAB hasn’t fully realised the potential of the MLC business in our view and that likely played a role in the decision to shed the unit. The JB Were and nabtrade wealth management businesses are being retained and were reportedly described by Mr Thorburn as “excellent businesses and platforms, and we are going to invest in them”.
National Australia Bank (ASX:NAB) 1H18 snapshot
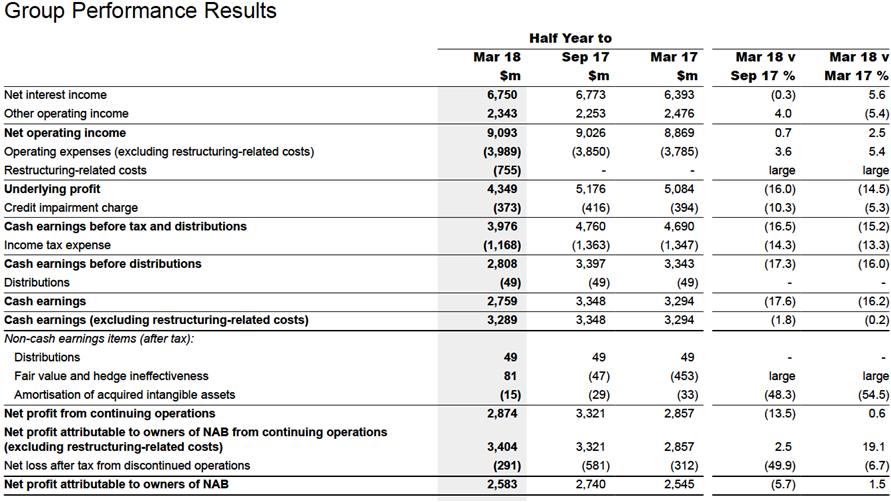
For the six months ending 31 March 2018, National Australia Bank (ASX:NAB) reported a slight 1.5% year-on-year increase in attributable net profit to $2,583 million. Net profit from continuing operations edged up 0.6% to $2,874 million and a slightly smaller net loss after tax from discontinued operations provided a slight boost.
Source: National Australia Bank (ASX:NAB)
Cash earnings – which are the more closely watched profit metric for NAB and its peers – slipped 16.2% to $2,759 million.
The significant slippage in cash earnings was mostly due to substantial ($755 million) restructuring-linked costs that saw operating expenses surge 25% year-on-year.
The restructuring costs primarily relate to trimming the headcount at the bank and a new technology program. At the end of April the workforce had declined by around 1,052 full time employee equivalents.
Last November NAB (ASX:NAB) announced it would cut its workforce by a net 4,000 jobs, or about 12% of its workforce over the next few years in an automation and streamlining of its business using new technologies. The CEO said at the time, “As we simplify, we automate processes and things move to digital channels we will need less people and as that happens we estimate there will be 6,000 less people needed in three years’ time”. The bank will be adding 2,000 people with different capabilities and skillsets over the same time frame. The hiring will mainly be in areas such as data science, technology and AI (artificial intelligence).
The goal is to realise some $1 billion in annual savings by the end of FY20 and this will mean about a $1.5 billion increase in investment spending over the next few years.
Excluding restructuring costs, cash earnings of $3,289 million were down only a marginal 0.2% from a year earlier. Diluted earnings per share, excluding restructuring costs of 117 cents were approximately 2% lower year-on-year. The fully franked dividend of 99 cents a share was flat.
Looking at the performance by division for cash earnings and the core Business and Private Banking division delivered an 8.3% year-on-year increase to $1,482 million, while the smaller New Zealand Banking business was also a strong performer, with cash earnings up 8.6% to $494 million in local currency. Consumer Banking and Wealth posted a 5.2% increase to $804 million and Corporate and Institutional Banking performed sluggishly, with cash earnings dipping 1.6% to $778 million.

Source: National Australia Bank
The group net interest margin, a key gauge of the profitability of core banking profitability, increased by 5 basis points year-on-year to 1.87%. A repricing of mortgages and lower funding and liquidity costs were positive factors, more than offsetting a headwind from the bank levy and other factors.
Revenue (net operating income) grew 2.5% year-on-year to $9,093 million, driven by growth in housing and business lending and higher margins, partly offset by lower Markets and Treasury income.

Source: National Australia Bank (ASX:NAB)
Net interest income increased $357 million, or 5.6% to $6,750 million, propelled by higher housing and business lending, repricing activity and lower funding costs. That was partially offset by competitive pressures and product mix changes on housing lending margins and the impact of the bank levy.
Other operating income declined $133 million or 5.4%, with the underlying decrease primarily mainly driven by lower trading revenue in Markets and reduced risk management income in the Treasury segment, partially offset by higher sales of risk management products. Fees and commissions revenue edged up 1.6% to $1,088 million, but could not offset a 15.4% slide in trading income to $610 million and a 5.7% decrease in other revenues to $645 million.
Operating expenses surged 25.3% or $959 million to $4,744 million, with the bulk of the increase due to restructuring-related costs ($755 million). Excluding those, operating expenses increased $204 million or 5.4% to $3,989 million.
Focusing on the movement in costs excluding restructuring-related costs and personal expenses were flat at $2,221 million. Occupancy costs edged up 2.9% to $349 million and general expenses increased 15.8% to $1,419 million due to higher investment spending for improving the customer experience, payments infrastructure and others.
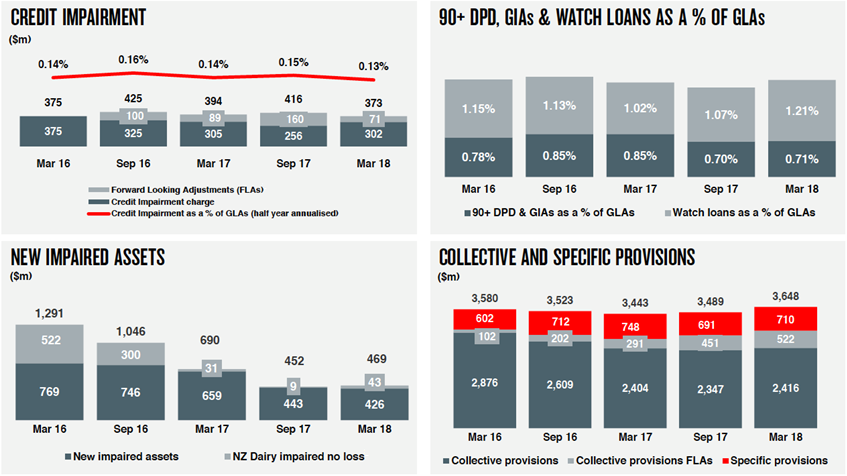
NAB’s credit impairment charges declined by $21 million or 5.3% year-on-year to $373 million, with the decrease mainly due to fewer impairments of large exposures in Corporate and Institutional Banking and lower charges in Business and Private Banking. These were partially offset by an increase in collective provisions for planned model changes and FLAs (Forward Looking Adjustments) for certain sectors. As a percentage of gross loans and acceptances (GLAs) credit impairment charges decreased 1 basis point to 13 basis points.
Asset quality continues to be solid, with loan repayments more than 90 days past their due date and gross impaired assets down 14 basis points year-on-year to 0.71% of gross loans and acceptances.
Although it was down on a yearly basis, it was a one basis point increase from six months earlier. The year-on-year improvement was due to a stronger backdrop for New Zealand dairy customers and other “successful work-out strategies” across the Australian business lending portfolio.
Source: National Australia Bank (ASX:NAB)
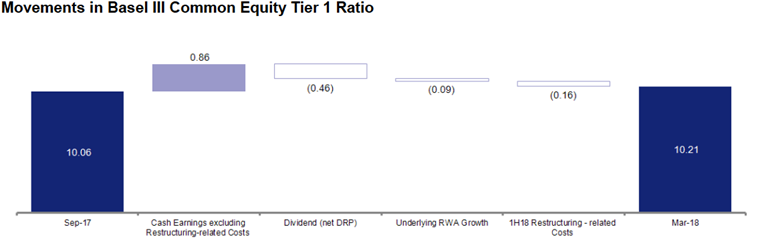
The group’s Basel III CET1 (common equity tier 1) ratio at the end of March 2018 was 10.21%, marking a 10 basis point increase from a year earlier and a 15 basis point lift from the end of September 2017. The key factors influencing the change over the past six months were cash earnings excluding restructuring related costs resulting in an increase of 86 basis points, partially offset by a 46 basis point reduction from the dividend net of the DRP (dividend repayment program), 9 basis point decrease from growth in underlying RWA (risk weighted assets) and 16 basis point headwind from restructuring-related costs in the first half of the fiscal year.
Source: National Australia Bank (ASX:NAB)
The bank appears capably positioned to meet APRA’s ‘unquestionably strong’ CET1 target of 10.5% by January 2020, especially given the planned divestment of MLC.
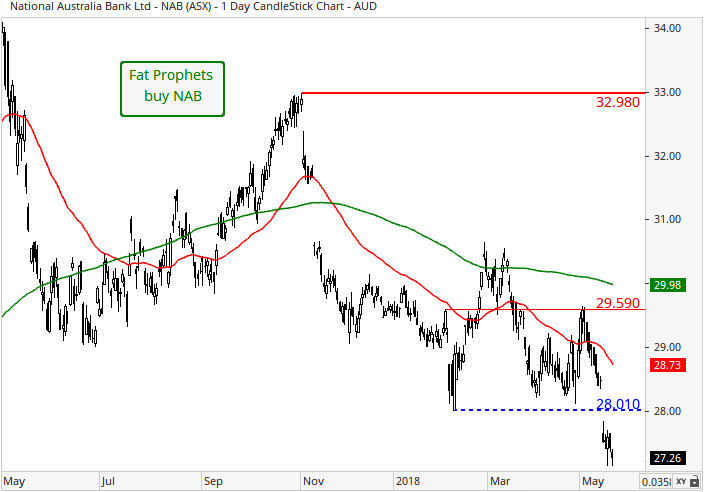
Turning to the to the technical picture and the daily chart, the bearish moving average crossover present since November 2017 is suggestive of momentum to favour the downside. This is when the 50-day moving average (red line) crosses below the 200-day moving average (green line). Support at the February intra-month low of $28.01 has also given way. For the short-term technical outlook to improve, a decisive break above the 200-day moving average (green line) of $30.42 is required. Should this positive development evolve, then medium-term momentum would shift back in favour of the bull-camp.
On the monthly chart, downside support is expected at the 78.6% Fibonacci retracement of $26.02 as represented by the thin-blue set of retracements, should the bears remain in control over the near term. It is important that the bulls defend this level, and a consolidation unfolds over the medium-term. Should this occur, then this would encourage a period of price-stabilisation to evolve, and thus ease the recent weakness in share price.

If this favourable scenario was to evolve, then from a probability standpoint, a gradual ascent towards resistance evident between $34.09 and $34.79 is deemed viable. This is made up of the May 2017 high and the 78.6% Fibonacci retracement (red set of retracements) respectively. Overall, the series of higher lows and higher highs are characteristics of a dominant long-term uptrend in place, and thus would likely steer the prevailing direction of National Australia Bank.
Summary
NAB, along with peers, has underperformed over the past year, battered by several headwinds such as the bank levy, increase in regulatory oversight and the Royal Commission weighing on sentiment. NAB has also earlier been the ‘ugly duckling’ of the big banks, but strides to transform the business (i.e. the demerger of the UK Clydesdale Bank) have been made and we believe the bank is slowly developing the platform to lift its cash return on equity from current levels. The divestment of the MLC business is the right move in our view, especially with the prospects of increased scrutiny and costs in the wake of the Royal Commission.
Looking at the valuation, NAB (ASX:NAB) shares trade on just 12.4x the average FY18 earnings estimate and 11.2x FY19, with a projected yield of approximately 7.2%.
The FY18 price to book value multiple is also modest at 1.4x.
NAB (ASX:NAB) will remain held in the Fat Prophets Portfolio. For Members without exposure and a medium-term time frame, we recommend the stock as a buy.
Disclosure: NAB (ASX:NAB) is held in the Fat Prophets Concentrated Australian Share and Australian Share Income models.

