
1HY18; work to do in the second half
Newcrest Mining (ASX:NCM) has got work to do in the second half of 2018, after having revealed a soft interim result for 2018. Higher commodity prices could not offset the impact of a poor operational first half. Operations also delivered a lower net cash flow for the first half, but the balance sheet did however run against the trend. The Board declared an unchanged interim dividend.
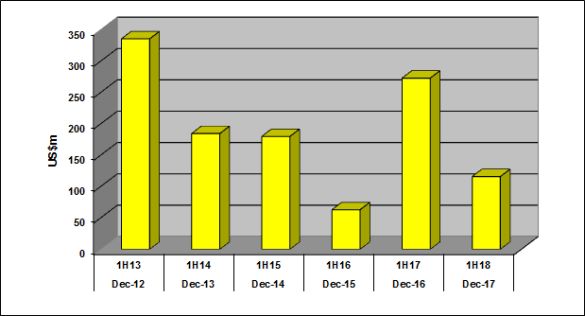
On a 5.0% decline in revenue compared to the year earlier result, the company reported a fall in its first half underlying profit. The following chart shows first half underlying profits:
Source: Newcrest Mining (ASX:NCM)
Revenue came in at US$1.7 billion and net underlying profit fell by a significant 58% compared to the comparable result for 2017, to US$116 million. Driving the result was a fall in gold production in the interim half accompanied by a rise in operating costs. A partial offset was the reporting of higher realised commodity prices for the interim half. We found the overall result to be a little disappointing.
A number of factors impacted on the company’s first half result and these are shown in the following waterfall chart:

Source: Newcrest Mining (ASX:NCM)
As Members can see from the above chart, revenue had a negative US$90 million impact on the result, with two key constituents in price and volumes delivering divergent outcomes.
Sales volumes in both gold and copper combined delivered a negative US$167 million against the 2018 interim revenue result. Gold sales fell by 7.4% on the first half 2017, to 1.1 million ounces. Sales fell on lower gold production for the interim half to 1.1 million ounces which represents a fall of 7.7% on the 2017 interim result, to contribute negative US$114 million to the result. Behind the lower production outcome for the half was a seismic event at Cadia. The shutdown saw gold production fall by 20% on the first half 2017, to 301,000 ounces. Partial production offsets came from Gosowong and Bonikro which reported rises of 4.1% and 16.4% respectively, to 128,000 and 78,000 ounces of gold.
The company has though maintained its 2018 guidance for gold production to be in the range of 2.4 million to 2.7 million ounces of gold.
Copper sales were also lower by 21% on the year ago result, to 38,000 tonnes and contributed negative US$53 million to the interim revenue result. Lower copper production impacted sales, following a 20% decline on the interim result 2017, to 39,000 tonnes. The same seismic event at Cadia impacted copper production.
The company has maintained its 2018 guidance for copper production to be in the range of 80,000 to 90,000 tonnes.
Silver production fell by 24% on the interim result 2017, to 493,000 ounces. The Cadia event was responsible for the result. The company does not provide guidance for silver production.
A partial offset were higher realised gold and copper prices which combined added US$80 million to the revenue result. The following chart shows the gold price:

Source: Index mundi
The company reported a realised gold price of US$1,295 an ounce, representing a rise of 1.4% from a year earlier. The gold price movement added US$21 million to the result. The reported realised copper price surged ahead by 31% on the interim result in 2017, to US$3.01 per pound. The copper price movement added US$59 million to revenue for the half.
We certainly have a positive view on the gold price, with an expectation that it will close 2018 out in the range of US$1,550 to US$1,600an ounce.
Our view on the copper price is also positive with an end-year close price in the range of US$3.60 to US$3.80 per pound. At the time of writing, gold was trading around US$1,317.50 an ounce and copper US$3.05 per pound.
A disappointment in the interim result was all-in sustaining costs (AISC), with the printing of a rise.
The company reported an 11.7% increase in its AISC compared to the first half 2017, to US$860 an ounce. Driving the result were the Lihir and Telfer operations which both reported higher AISC for the half. On lower production numbers Lihir and Telfer reported rises in AISC of 19% and 20% respectively, to US$1,086 and US$1,227 an ounce. A positive and partial offset to the Lihir and Telfer AISC results was the Cadia site which printed an improvement in AISC. Despite the seismic event Cadia reported a 48% improvement on the interim 2017 outcome to US$135 an ounce.
AISC guidance for 2018 is in the range of US$2.1 billion to US$2.3 billion.
Capital expenditure for the reported half was marginally ahead of the same number from a year earlier. For the first half 2018, capital expenditure was 1.1% higher compared to the first half 2017, at US$273 million.
Free operating cash was a casualty of the operational performance with the printing of a fall for the reported half. The following chart shows first half free operating cash flow:

Source: Newcrest Mining (ASX:NCM)
The company reported a fall of 25% on the first half 2017 result in its free operating cash flow, to US$453 million. All the mine sites delivered positive free operating cash flow for the reported half, which is a goal of the company.
Pleasingly, the actions taken by the company to stabilise and then strengthen its balance sheet are now paying dividends. The following figure shows the company’s gearing:

Source: Newcrest Mining (ASX:NCM)
As Members can see from the above chart, at 31 December 2017 gearing stood at 16% compared to 21% from a year earlier.
The current gearing level sits well below the company’s target of 25%. The trend is welcomed.
Net debt improved over the reported half to stand at US$1.4 billion at 31 December 2017, down from the US$1.9 billion reported at 31 December 2016. Debt improved by US$124 million from 31 December 2016 to stand at US$1.9 billion at 31 December 2017. Cash resources surged ahead by 174% compared to the level from a year earlier, to US$556 million. We are now far more comfortable with the structure of the balance sheet.

The Board continues to honour its commitment to paying dividends, with the declaration of an interim dividend for 2018 of US7.5 cents per share.
The company paid the same interim dividend for 2017. We note the dividend policy is to payout 10% to 30% of free cash flow each year with a minimum annual dividend of not less than US15 cents per share. The return to paying dividends is certainly welcome, and going forward, the company’s operations and financials can, we believe, support future dividends and new growth initiatives.
Newcrest Mining (ASX:NCM) had been making good progress in addressing the operational issues that weighed on its production and financial numbers. We believe that the first half result 2018 only swayed the progress of the company. We will be looking to the second half to redress.

We continue to believe that the suite of gold assets the company holds can deliver value to shareholders in the medium to long-term.
The key remains in successfully generating and then utilising its cash flows to further strengthen its balance sheet, seek out growth opportunities and honour the dividend commitment.
Given the operational and balance sheet progress made to date, Newcrest Mining continues to, we believe, move in the right direction.
Consequently, Newcrest Mining (ASX:NCM) will remain held in the Fat Prophets portfolio.
Disclosure: Newcrest Mining (ASX:NCM) is held within the Fat Prophets Mining & Resources Model.

