
Getting the Green Light
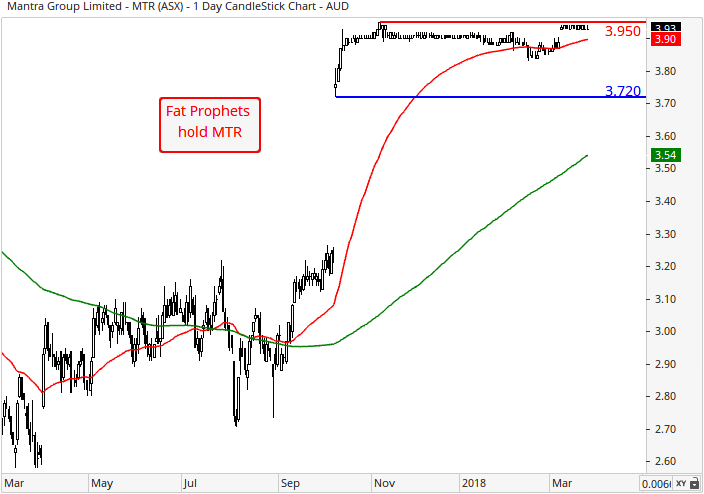
Mantra Group (ASX:MTR) has received approval from the key regulatory authorities for its takeover from the French hotel chain Accor Hotels. The deal remains subject to the approval of Mantra’s shareholders and approval from the Federal Court of Australia, both of which we expect to be forthcoming. Accordingly, the deal could be concluded as early as May 2018.
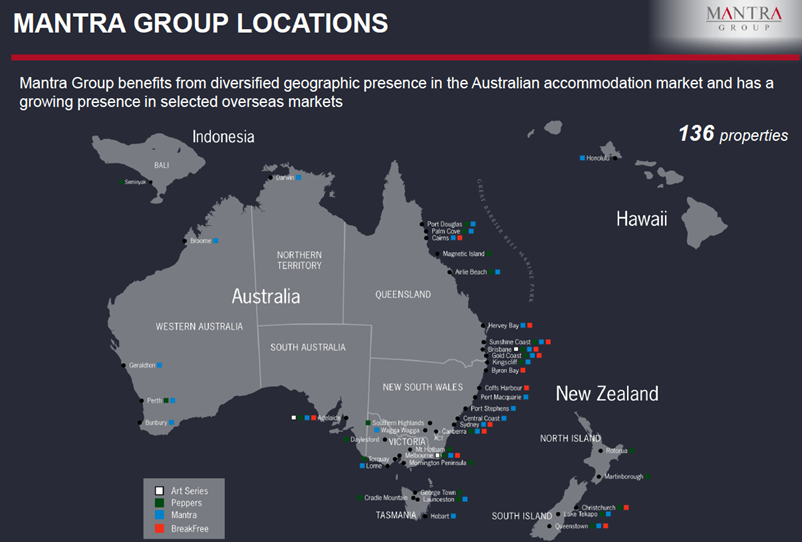
Mantra’s business model has been focused on serviced apartments offered through the Peppers, Mantra, Art Series and Breakfree brands.
Source: Mantra (ASX:MTR)
Accor’s business is more hotel-style centric via the Ibis, Mercure, Sofitel and Novotel brands. This makes for an attractive combination in our view and
in October 2017, Accor made a bid for Mantra of $3.96 per share in cash (being $4.02 per share, less the final FY17 dividend).
That includes the scope for a potential special dividend with a maximum value of 23.5 cents per share to be deducted from the $3.96 headline value. Given that context, Mantra Group has not declared a dividend for the half year ended 31 December 2017.
The approximate $1.2 billion offer was unanimously approved by Mantra’s Board and the company engaged with the Foreign Investment Review Board (FIRB) and the Australian Competition and Consumer Commission (ACCC) to seek regulatory approval from these agencies. The condition relating to approval by the New Zealand Commerce Commission was waived.
Prior to approval, we were of the view that getting sign-off should be relatively smooth sailing given the fragmented nature of Australia’s hotel market. The deal would see the merger of the country’s two biggest hotel operators and combined Accor and Mantra would have over 300 hotels and 50,000 rooms, but this equates to a market share of just over 10%. This is also without factoring in the amount of disruptive competition from the likes of the AirBnb platform.
Although it took longer than expected to get the all-clear, on 8 March 2018, the ACCC announced it will not oppose the acquisition. Of the decision, Chairman Rod Sims said, “The combined Accor-Mantra will still have to compete with other international and national hotel chains, as well as many independent hotels and accommodation providers” and added, “The combined Accor-Mantra will have a large number of properties in some areas particularly in certain holiday destinations in Queensland. However, after a detailed review the ACCC has found that there are also sufficient other options nearby for visitors which will provide competition to Accor-Mantra.”
The FIRB was the next to approve the proposed transaction on 20 March 2018, with Federal Court of Australia approval and the sign off from shareholders to come. We expect both to be forthcoming. Mantra expects to distribute its Scheme Booklet to shareholders in April, with a vote in May. Subject to the satisfaction of all outstanding conditions, Mantra expects the Scheme to be implemented in May 2018.
We recommend that Members maintain their holdings in Mantra Group (ASX:MTR) as the acquisition process plays out.
1H18 snapshot
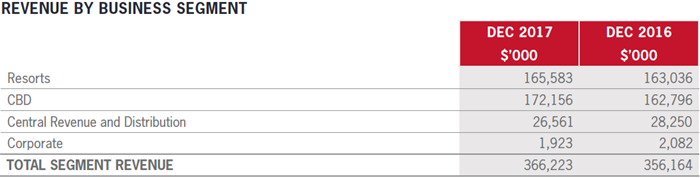
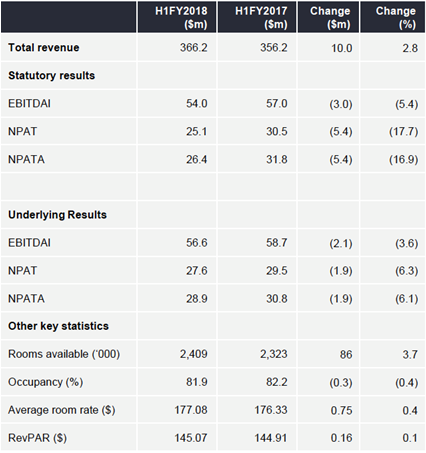
Mantra Group’s operating profit and bottom line result was modestly below expectations in 1H18 despite reporting record interim revenue of $366.2 million for the six months ended 31 December 2017. That marked a $10.1 million, or 2.8% increase driven by the acquisition of 10 new properties to increase the total number of rooms across the group, increased travel to some locations and marginal increase in Revenue Per Available Room (RevPAR).
The company particularly highlighted continued domestic and international travel growth to the Queensland and New Zealand regions, along with strong demand in the CBD segment in Sydney, Canberra and Adelaide. Hawaii and Perth were adversely impacted by supply growth in the market, while Melbourne suffered somewhat due to constrained demand from new supply.
Occupancy in 1H18 was 81.9% at an average rate of $177.08, compared to the previous year’s slightly higher occupancy rate of 82.2% and slightly lower average rate of $176.33. That resulted in a marginal $0.16 or 0.1% year-on-year increase to a record RevPAR of $145.07 in 1H18.
By core segment, resorts (+1.6%) and CBD (+5.7%) revenues increased, while Central Revenue and Distribution (CR&D) segment (-6.0%) revenues declined.
Source: Mantra (ASX:MTR)
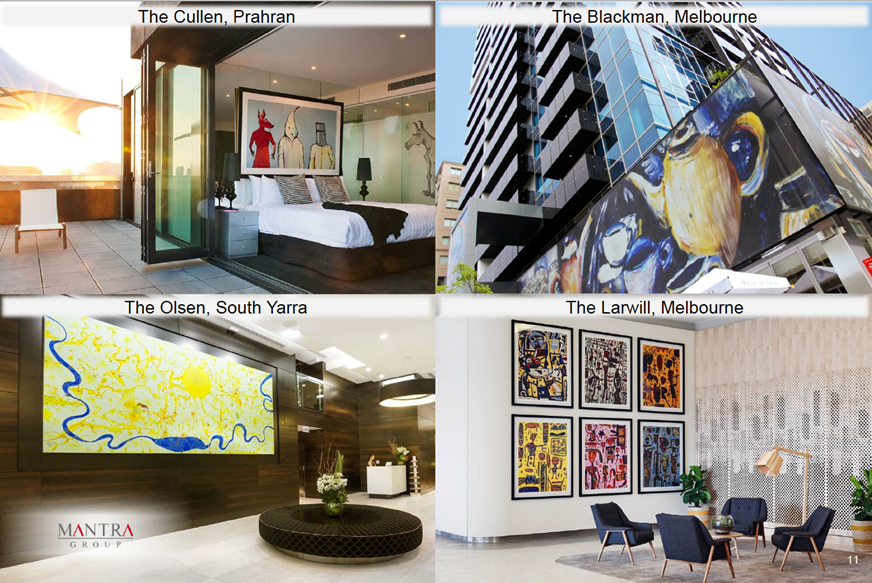
During the 1H18 period Mantra acquired 10 new properties, increasing available rooms by 2.6% in the six-month period. Seven were Art Series Hotel Group properties, including The Watson (Adelaide), The Olsen, The Blackman, The Cullen, The Larwill, and The Chen (all Melbourne), and The Johnson (Brisbane).
Source: Mantra (ASX:MTR)
The others were the Mantra Sydney Airport Hotel (Sydney), Mantra Macarthur Hotel (Canberra) and Peppers FV (Brisbane). The Mantra Sydney Airport Hotel, a management agreement property joined the CR&D segment, while the other nine properties joined the CBD segment.
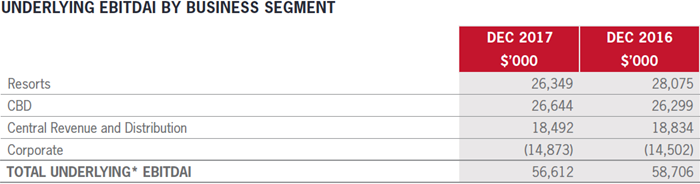
Group underlying earnings before interest, tax, depreciation, amortisation and impairment (EBITDAI) for 1H18 was $56.2 million, down $2.1 million or 3.6% from a year earlier as the underlying EBITDAI margin contracted one percentage point to 15.5%.
Resorts underlying EBITDAI decreased $1.8 million, or 6.1% to $26.3 million as the EBITDAI margin compressed 1.3 percentage points to 15.9%. New properties contributed $0.8 million in EBITDAI during the period.
Results from the US resorts operations were negatively impacted by an increase in supply pressuring room rates and a general reduction in demand for hotel rooms and conference facilities in Waikiki. Annual award payroll increases above CPI also weighed on the result somewhat.
Underlying EBITDAI in the CBD segment increased a marginal 1.3% or $0.3 million to $26.6 million, with the margin falling to 15.4% from 16.2%. Organic EBITDAI dipped 1.0%. Lower RevPAR in Melbourne (-9.5%) and Perth (-3.2%) weighed on the result. New supply in both markets was a headwind.
Source: Mantra (ASX:MTR)
CR&D underlying EBITDAI decreased 1.8% or $0.3 million to $18.5 million, with the decrease mainly due to a one-off termination payment received in the prior corresponding period which was not repeated in 1H18.
At the group level, underlying NPAT for 1H18 came in at $27.6 million, representing a $1.9 million or 6.3% year-on-year decrease. After accounting for transaction costs and costs of the proposed acquisition by Accor, statutory NPAT of $25.1 million was $5.4 million, or 17.7% lower than in 1H17.
Source: Mantra (ASX:MTR)
While Mantra’s financial results are typically front-heavy, the Commonwealth Games is expected to drive stronger results in the second half of the fiscal year. Some 23 of the group’s hotels are located on the Gold Coast, positioning Mantra to participate in the economic boost to the region.
Summary
Although slower than initially expected, the takeover of Mantra by Accor has progressed and obtained key approvals from the FIRB and ACCC.
Mantra expects to distribute its Scheme Booklet to shareholders in April and have a shareholder vote in May. Subject to the satisfaction of all outstanding conditions including shareholder approval and sign off from the Federal Court, Mantra expects the Scheme to be implemented in May 2018.
Mantra has the scope for a potential special dividend with a maximum value of 23.5 cents per share to be deducted from the $3.96 headline value of Accor’s bid. Given that context, Mantra Group has not declared a dividend for the half year ended 31 December 2017.
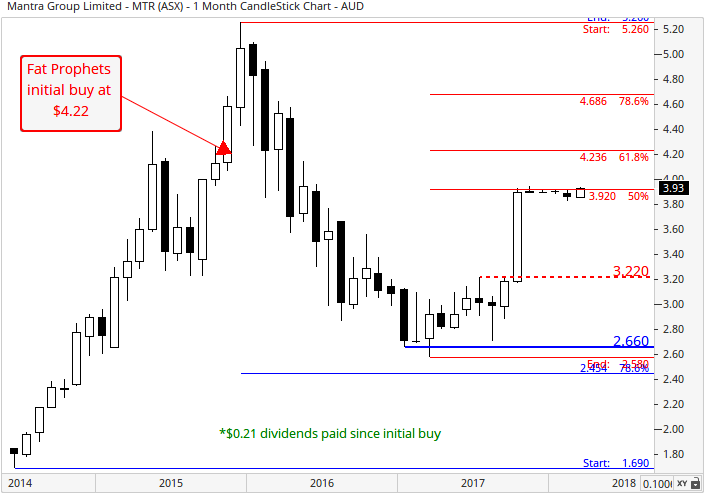
Mantra (ASX:MTR) will remain held in the Fat Prophets portfolio at this juncture.
Disclosure: Mantra (ASX:MTR) is held in the Fat Prophets Global Contrarian Fund, and the Fat Prophets Small/Mid-Cap Model Portfolio.

