
An Attractive Package
Orora (ASX:ORA) has delivered solid returns for shareholders since its demerger and the fundamentals continue to be attractive. There is scope for margin improvements at the North America businesses and the company has a strong balance sheet providing the financial flexibility to supplement organic growth with acquisitions.
1H18 snapshot
Overall, Orora’s interim numbers were strong and investors were content with the results, bidding the shares up 4% after the release back in mid-February.
Revenue increased 6.2% year-on-year to $2,097.8 million, driven by several factors including 3.0% growth in OPS (Orora Packaging Solutions) revenues. In the Landsberg Division sales increased 5.0% due to winning some new corporate accounts, growth from existing business and by passing through higher paper prices in the United States. That was partially offset by lower revenues from the Manufacturing Division and Orora will redirect this capacity to support future Landsberg and direct channel growth.
There was also a contribution from incremental revenues from the Orora Visual acquisitions completed in FY17, higher volumes in the Glass business due to solid demand from the wine industry and higher volumes in Fibre, reflecting a better season from certain fresh produce sectors. Partially offsetting this were adverse currency movements. Local currency sales increased by 11.1%.
By segment, the Australasian business posted revenues of $1,042.4 million in 1H18, up 5.0% from 1H17. Underlying sales in Australasia were up 4.4% after considering the pass through of higher aluminium prices. North America revenue increased 7.4% to 1,055.4 million.
Group EBITDA came in at $227.3 million, marking a 10.7% increase, while group EBIT was up 10.5% to $165.3 million. On a constant currency basis EBIT increased 11.9%. The improvement in EBIT was attributable to Fibre Packaging revenue and margin gains in targeted segments, additional production volume at B9, better efficiencies across the Australasian business, ongoing improvements at OPS and contributions from the recently completed acquisitions in Orora Visual. These positive factors more than offset some higher input costs at B9, adverse weather events at OPS and currency movements.

Source: Orora (ASX:ORA)
Statutory net profit after tax (NPAT) was $103.8 million, while NPAT before significant items was $105.7 million, representing a 14.8% increase from a year earlier. That translated into earnings per share, excluding significant items of 8.8 cents, up 14.7%.
The significant item in the accounts was a $1.9 million net profit on the sale of Fibre Packaging’s Smithfield site, offset by costs related to the restructure of Fibre Packaging in NSW and potential decommissioning costs associated with the Petrie Mill site.
The interim ordinary dividend of 6.0 cents per share was a 20% increase from a year ago and is 30% franked. That represented a pay-out ratio of approximately 69%, at the high end of the company’s 60% to 70% target range. The record date was 1 March 2018 and the payment date 16 April.
Operating cash flow of $155.9 million was down marginally (1.0%) from the prior year period. The cash conversion rate of 63% was down from 72% in 1H17. The
return on average funds employed (RoAFE) was 13.9% in 1H18, marking a 70 basis point improvement from a year earlier and a 30 basis point increase from June 2017. This reflected higher earnings and solid balance sheet management.
The company’s balance sheet is in good shape, with leverage (net debt to trailing 12 months underlying EBITDA) of just 1.5 times, down from 1.6 times at June 2017. Gearing was flat at a modest 29%. Net debt at the end of 2017 was $657 million, compared to $674 million at June 2017 and $639 million a year ago. Orora remains in a good position to continue supplementing organic growth with acquisitions, especially as there are still plenty of bolt-on acquisition opportunities around.
The company is also well placed to return capital to shareholders if it cannot find investment opportunities with adequate return metrics. Undrawn debt facilities totalled $340 million at year-end, and refinance discussions were underway at the time of the results announcement for $100 million of facilities maturing in April 2018.

Source: Orora (ASX:ORA)
Looking at the segment performance briefly and the Australasian EBIT increased 11.1% year-on-year to $121.1 million.
Fibre earnings grew on higher volumes and efficiency improvements at the B9 Recycled Paper Mill, along with steady sales growth that more than offset cost input headwinds. Beverage earnings were higher, with Glass volumes rising due to solid demand from the wine sector and delivering further operating efficiencies. The EBIT margin expanded 60 basis points to 11.6% and RoAFE improved 1.1 percentage points to 13.0%.
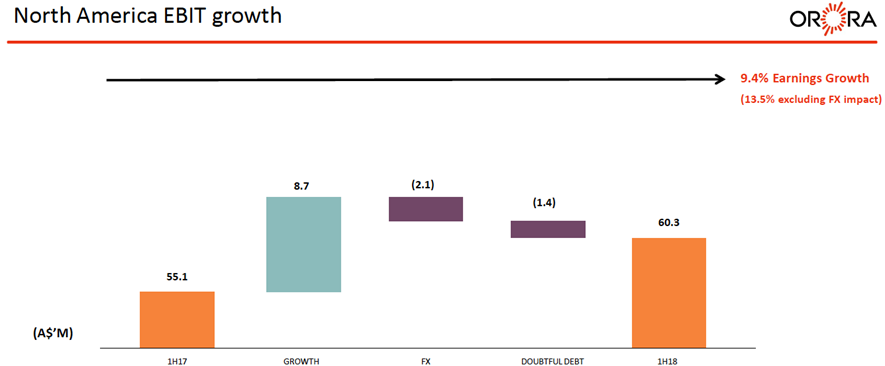
The North America segment saw EBIT grow 9.4% to $60.3 million. Changes in exchange rates were a headwind and in local currency, EBIT was up 13.5% to US$47.0 million. The OPS business grew sales and expanded margins through operating efficiencies and higher volumes from existing corporate accounts and new customer wins. Management reported that Orora Visual financial results are improving as progress is made on the integration. A doubtful debt provision at Orora Visual was a minor headwind as can be seen in the following ‘waterfall’ chart of North America EBIT.
Source: Orora (ASX:ORA)
The North America EBIT margin ticked up 10 basis points to 5.7%, but RoAFE for the segment compressed six percentage points to 19.1%, leaving room for improvement in the second half of the year.
Orora’s outlook was positive, but scarce on details with the company simply pointing to “higher” 2018 earnings in constant currencies, “subject to global economic conditions.”
The company said that benefits delivered from recent capital investment has provided the confidence to further invest, with the Global Innovation initiative increased by $30 million to $75 million, of which $45 million is already committed. Management did warn that in Australia the electricity market is expected to continue to be volatile and the estimated adverse impact in NSW is to the tune of $6 million to $8 million, with alternative supply options being assessed.

Summary
We believe Orora continues to well placed to capitalise on any improvement in general economic activity. Orora has delivered solid results despite generally subdued market conditions through a combination of efficiency gains, business improvement initiatives and acquisitions. Looking ahead, we expect North America and Orora Visual to be key earnings drivers, at least over the near-to-medium-term, given the scope for margin improvement. The recent currency headwind has the potential to change direction and become a tailwind. In addition, the company should be able to supplement organic growth with acquisitions.
Orora (ASX:ORA) shares trade on 19.5 times FY18 earnings estimates, falling to 18.1 times the following year, with a partially (~30 percent) franked forecast dividend yield of 3.7% increasing to 3.9% over the same time frame.

Orora (ASX:ORA) will remain held in the Fat Prophets portfolio. We recommend the stock as a Buy around current prices for Members without exposure.
Disclosure: Orora (ASX:ORA) is held with the Fat Prophets Concentrated Australasian Share, and Small & Mid-Cap Models.

