
Back to the future
As far as our sell recommendations have gone in recent years, Vocus Group has been one of the more satisfying. We gained exposure to the shares not once, but twice as the company swallowed up both Amcom Telecommunications, and M2 Group. We originally entered both on ‘value’ grounds, and latterly became concerned that Vocus was becoming too big for its boots, with a premium multiple to match. With integration risks abounding, and the technical picture also showing signs of topping out, we finally exited the shares around $7.75 in March 2016.
As it has turned out our fears proved well founded, with the integration of the various acquired businesses not going smoothly at all, with synergies over-estimated and financial estimates some way off the mark. This culminated in a series of profit warnings, and ultimately the departure of the company’s CEO last week, and resignation of the Chairman today. The market though has reacted positively to the senior management clear-out, and questions might not be asked as to whether a bottom has been reached.
Changes often start at the top, and with the shares having lost significant value since our exit, Vocus may actually becoming interesting again. While not wanting to succumb to a ‘value trap’ we are revisiting the case for a return to the stock. We are hence putting the telco on a traffic light alert.
Trouble in paradise
The case of Vocus is very much a textbook example, in our view, of why an acquisition for acquisition’s sake is not a slam-dunk recipe for success. If it were, every company would do it. The key as always is in the detail, and the realistic synergies and earnings drivers that will be gained as a result, and with due regard for the risks. This was sadly lacking in our view with respect to Vocus, and shareholders have suffered the consequences. A glimmer of hope was also extinguished when two private equity companies walked away from bids made for Vocus last year.
In the past three years, the company has completed $5 billion in mergers with Amcom and M2, while also acquiring Nextgen for $807 million. Management has shot for the stars, and looked to take on the world (or at least the Australian telco industry) and thus far have come up short.
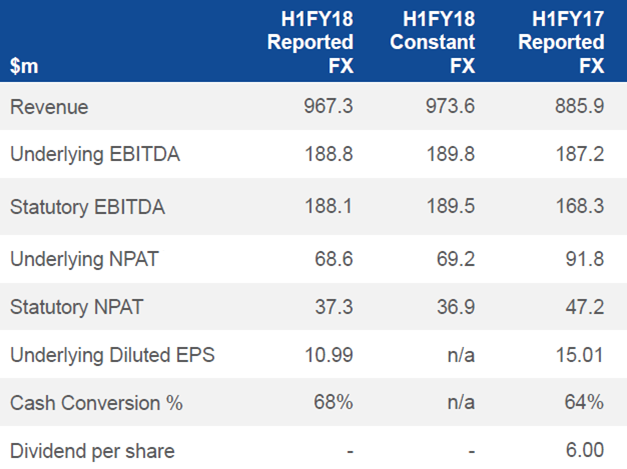
Financial underperformance is clear to see in the half year results, although admittedly the group financial summary presentation slides do their best to not highlight the percentage deteriorations. Interim net profit fell 21% to $37.3 million. Management chose not to declare an interim dividend due to ‘competing demands and opportunities for capital investment’ and as a ‘more nimble’ approach to payouts being sought. Understandably the market did not take this well.
Source: Vocus Investor presentation
Underlying EBITDA (earnings before interest, tax, depreciation and amortisation) did rise 8% to $188.1 million with a plethora of adjustments following acquisitions, divestments and corporate restructuring. The board also chose to reduce full year EBITDA guidance to a range of $365 – $380 million (from $370 – $390 million). Full-year underlying profit was revised to between $125 million and $135 million, or about 10% below earlier forecasts. This also came on top of a 20% earnings downgrade in May last year.
Again this was something that the market did not take well, along with then CEO Geoff Horth’s comments that “today we deliver results that demonstrated progress in improving performance for our shareholders.” With a collapse in the share price and a suspension of the dividend, it is difficult to judge what angle he was coming from.
Needless to say the company’s cornerstone investors, and board had their say. Geoff Horth has parted ways, to be replaced on an interim basis by Michael Simmons, the company’s Head of Wholesale & International while a new CEO is sought. Mr Horth did a great job whilst CEO at M2 (which Vocus acquired) and was possibly out of his depth following the acquisition spree.
A change of strategy though is clearly needed, and with this it is probably no surprise that Chairman Vaughan Bowen has also stepped aside. He is to be replaced by his deputy Bob Mansfield, who previously chaired Telstra, and was the founding CEO of Optus. So he certainly has the capacity to make some tough decisions in our view.
A change in management will of course not be the only catalyst needed to ensure an earnings recovery, with the company hampered at the interims by ‘higher than expected subscriber acquisition costs.’ This in our view is symptomatic of the highly competitive environment in which the company operates, and also while large scale growth ambitions were not that well timed.
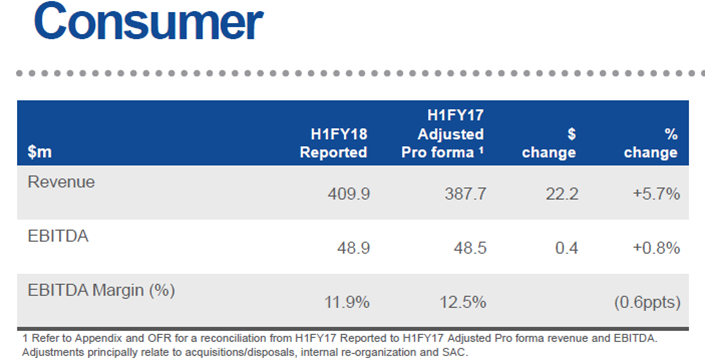
At the interims, the company’s consumer broadband business performed well, but not as well as expected. Revenues rose 5.7% to $409 million while EBITDA was flat at $48.9 million. NBN market share rose to 7.7% from 7.3%, and there may well be scope to lift the performance further as Vocus changes its sales strategy to a lower-cost digital channel approach.
Source: Investor Presentation
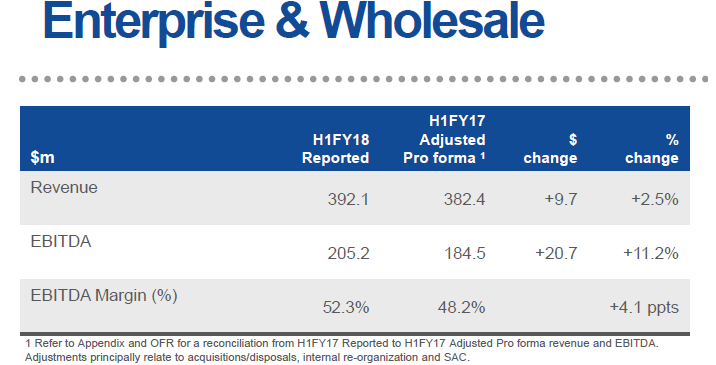
The company’s enterprise and wholesale division though did perform strongly, with EBITDA surging 11% to $205 million on revenue which was up 2.5% to $392 million.
Growth in data networks business was strong, with the company enjoying success in wins from the Federal government and on the East Coast. The bottom line here was boosted by margin expansion and strong cost control.
Source: Investor Presentation
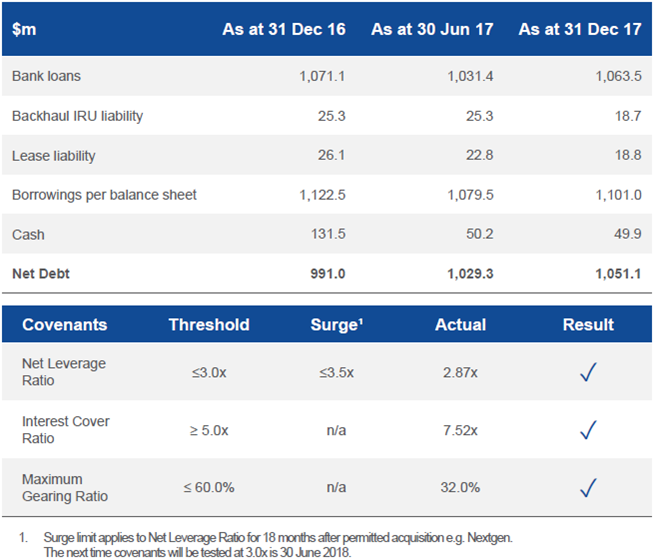
The company’s balance sheet has also been an issue, with net debt ballooning to $1.05 billion following a spate of acquisitions. The company’s net leverage ratio is around 2.9 times, which doesn’t leave much headroom below threshold covenants of 3 times.
Source: Investor Presentation
Some respite however is also in sight on the balance sheet front, with the company in the process of selling its New Zealand business (which owns the Slingshot and Orcon businesses).
The company has cited numerous growth opportunities for would-be buyers, with the unit delivering NZ$342 million revenue last year and N$60.9 million in underlying earnings.
Vocus is evidently looking for north of NZ$500 million for the business and has reportedly talked up a telco market which is arguably less competitive than Australia’s.
Management is said to have made much of the fact that the country’s population was set to hit 5 million by 2024 and has the highest fibre uptake in the world. In any event the proceeds will certainly go some way to alleviating balance sheet stress, and with covenants being revisited in June. In some ways it will be a race against the clock to get this done by then.
Also, a positive follow on will be with debt servicing costs falling, management will also be able to revisit dividends in our view, which will also boost investor sentiment. This is also as the company’s significant Australia Singapore cable project is on track to be in service by Q1 FY19.
Turning to the charts, on the daily chart, the bearish moving average crossover present since late-February is suggestive of momentum to favour the downside. This occurs when the 50-day moving average (red line) crosses below the 200-day moving average (green line). At present, a zone of support is located between $2.23 and $2.26. This is made up of the March intra-month low (horizontal solid-blue line) and the September 2017 low (horizontal thin-blue line) respectively.
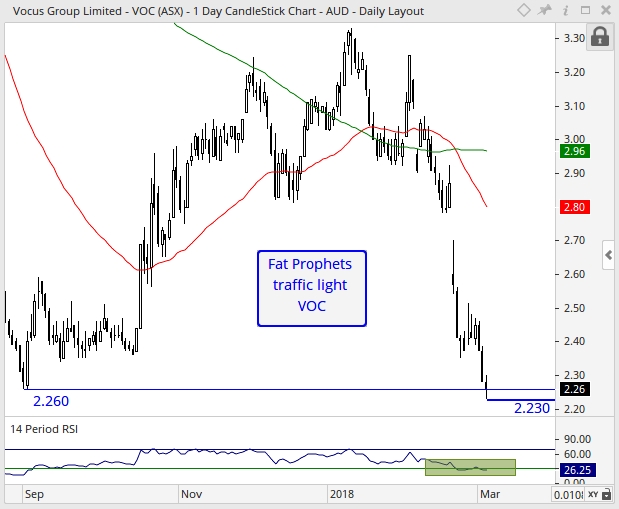
Positively, from a relative strength (RSI) perspective, this indicator has declined into oversold territory. This is suggestive of an exhaustion in short-term selling pressure, and hence it would be fair to say that a turning point or period of price stabilisation is near. Overall, and in order for the short-term technical outlook to improve, a sustained break above the 50-day moving average (red line) of $2.80 is required. If this was to occur, then this would shift momentum back in favour of the bull-camp.
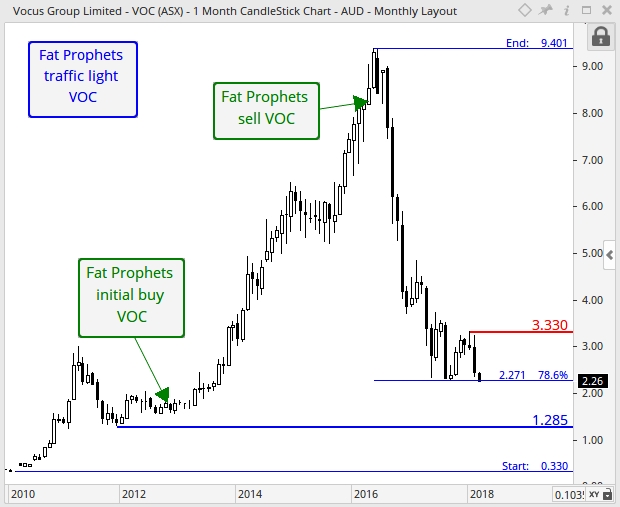
With reference to the monthly chart, prices are in flirtation-mode with support sighted at the 78.6% Fibonacci retracement of $2.27. It is important that the bulls defend this level, otherwise, the risk of a deeper decline down to the December 2011 low of $1.29 could very well be on the cards. In order for a broader bullish rotation to evolve, a sustained break above overhead resistance evident at the January high of $3.33 as marked by the horizontal red line is required. However, it should be noted that the long-term downtrend remains in play, therefore, any rise in the share price will likely be slow-coming.
Summary
Clearly Vocus’ share price (ASX:VOC) has been through the wringer in the past eighteen months, and since our exit, but we believe the scenario for a turnaround may be starting to emerge. The company is one of only four major telecommunications carriers in Australia and certainly has an opportunity to benefit, albeit the market is competitive.
New management will not be biased by the mistakes of the past which is a good thing in our view, while divestments should help the balance sheet, and facilitate the return of dividends. The presence of activist shareholders such as Hong Kong-based investment group Janchor Partners will also ensure that new management are kept on their toes.
Technically, the shares have yet to display signs of a turnaround, however the fundamental criteria is showing glimpses of emerging.
We are therefore placing Vocus (ASX:VOC) on a traffic light alert, with a view to potentially re-recommending the stock in the medium-term.

