
1H18; clipped a little but that’s all
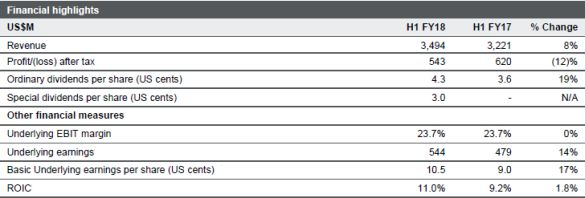
The positive momentum we have seen in the short-time South32 (ASX:S32) has been reporting its financials to the market diminished a little with the release of its 2018 first half result. Prices played a major role in the better underlying earnings result, but the company was not able to leverage its operations to gain maximum advantage. The balance sheet remains in top shape, while shareholders received a first half boost from a top up special dividend. The following table is a summary of the company’s first half result (ROIC – return on invested capital):
Source: South32 (ASX:S32)
We consider the first half result as satisfactory, given that the commodity pricing environment was amenable to generating profits. The company reported an improvement across the majority of its key investment metrics, but it was a half that could have been.
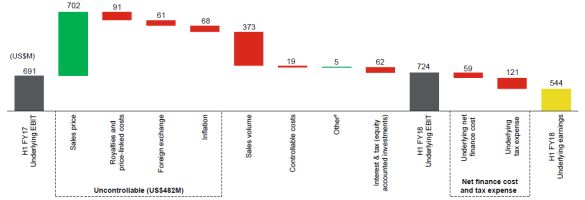
On an underlying basis, the company reported a 14% rise in its underlying earnings compared to the first half 2017, to US$544 million. The following chart shows the factors that had an influence on the company’s first half result (EBIT – earnings before interest and taxation):
Source: South32 (ASX:S32)
Driving the 2018 first half result was, as Members can see from the above chart, Sales prices which contributed US$702 million to the result compared to the US$661 million in the first half 2017. Going forward, we continue to hold a positive outlook for commodity prices and expect the company’s 2018 full year result will also bring with it a positive sales price variance. The company will report its 2018 full year result in August 2018.
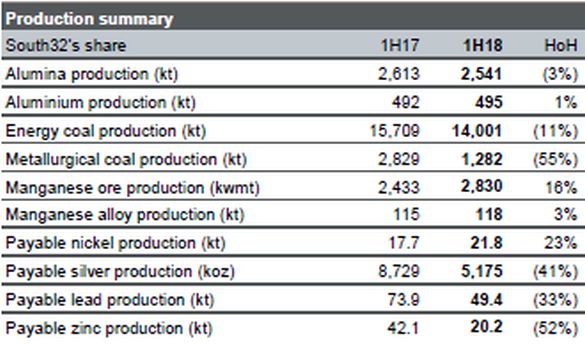
Disappointing in the first half result was the US$373 million lost as a result of lower sales volumes. The following table shows 2018 first half production outcomes:
Source: South32 (ASX:S32)
The company reported a negative sales volume variance of US$373 million compared to the US$243 million reported for the first half 2017. Production rates, as Members can see from the above table were in the majority negative. The standout operations were manganese ore and alloys, nickel and aluminium. Manganese production as shown above set a first half record on a higher grade and plant efficiencies. Nickel production benefitted from the ramp-up of the La Esmeralda mine.
The company’s Cannington mine produces silver, lead and zinc with lower grades and a reduction in mill throughput driving the fall in output for the first half. With an expectation of higher mining activity in 2019, the company has curbed 2018 operations to increase ore predictability and the stability of the ore body.
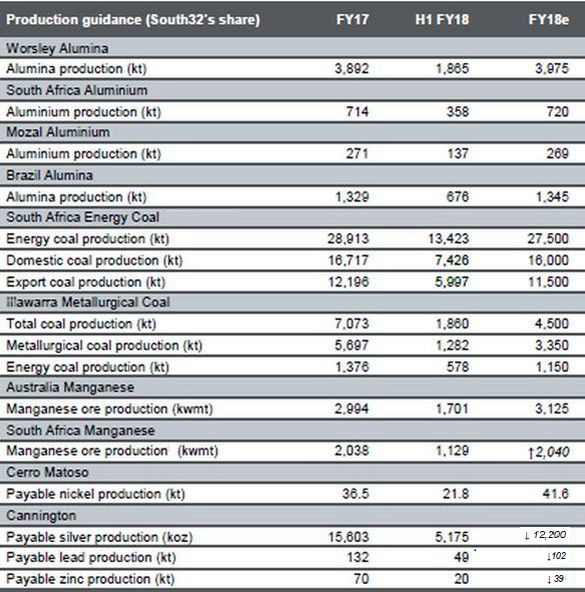
Across the company’s product offerings, 2018 production guidance was maintained with the exception of an upgrade for Manganese production and the product delivery from the Cannington operations being downgraded.
The following table shows production guidance numbers for 2018:
Source: South32 (ASX:S32)
The production upgrade for manganese in 2018 is a result of the company’s African operations (South32’s interest in ore 44.4% in manganese alloy 60%). The company expects infrastructure efficiency on higher third-party demand to drive the higher output in the second half. On the downgrade to the Cannington output, to ensure higher operational activity in 2019, the company did move to downgrade its silver, lead and zinc output from the mine in 2018.
We expect on a review of the production guidance numbers for 2018, that operations may again deliver another negative financial impact in 2018, albeit less severe. The company’s coal operations may play a significant and negative role in that scenario playing out over the remainder of 2018. Both anticipated softer third-party coal demand and mine scheduling are expected to be major influences on the forecast outcome for coal production.
Controllable costs for 2017 came in with a small negative impact of US$19 million compared to the positive US$239 million for the first half 2017. Certainly, a fall in volumes for the first half played a major role in the result. The following table shows the unit costs for the company’s major operating segments (South32 holds varying interests in the assets listed below, FOB – free on board):

Source: South32 (ASX:S32)
The company’s South African energy coal operations (South32’s interest 92%) were to the fore on the operating cost front delivering US$44 million into the cost pool. A stronger Rand did play a role as did internal country events in the mining sector. Illawarra Metallurgical Coal felt the sting of higher costs on a stronger Australian Dollar and a skewing of coal production out of the first half. The standout operation was the Cerro Matoso (South32’s interest 99.9%) nickel operation on the back of ramping up production at the La Esmeralda deposit.
On operating cost guidance for 2018, the company continues to see pressure on its cost structures in the second half. The following table shows unit cost guidance for 2018 for the company’s main operations:
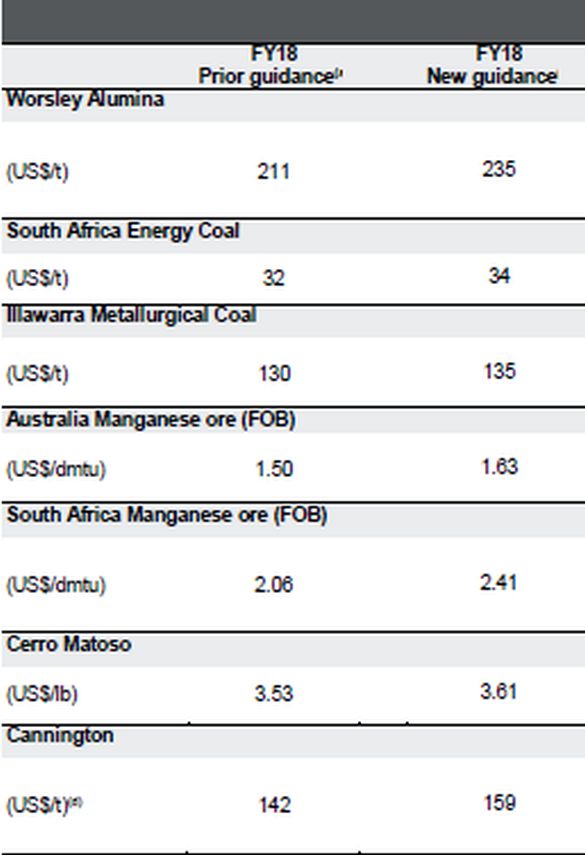
Source: South32 (ASX:S32)
Although the controllable cost variance was marginally negative for the first half, we consider the ongoing systematic removal of costs remains a management priority.
Net cash flow from operations took a tumble on the back of the softer operational performance for the first half 2018. Net cash flow from operations fell by 37% compared to the first half 2017, to US$438 million. Despite the difficult operating environment, cash flow remained positive.
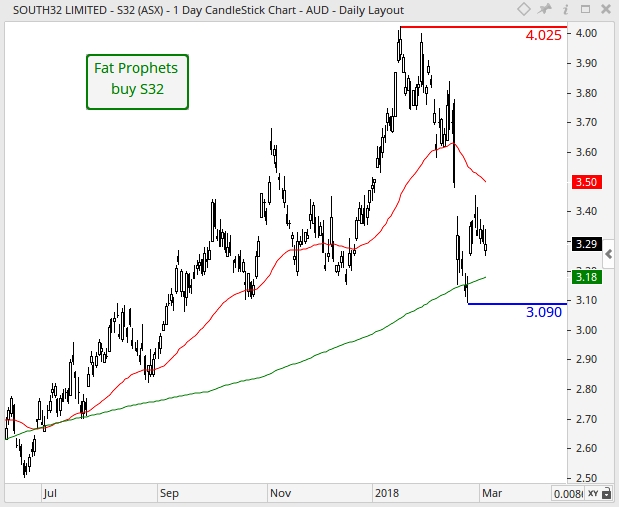
Turning to the daily chart, a zone of support is indicated between $3.09 and $3.18 if the bears were to exercise downward pressure over the shorter-term time frame. This is made up of the late-February low (horizontal blue line) and the 200-day moving average (green line) respectively. Overall, and in order for the short-term technical outlook to improve, a sustained break above the 50-day moving average (red line) of $3.50 is required. If this was to occur, then upward momentum would likely rise and a resumption of the medium-term uptrend is likely to follow.
The company reversed the recent trend of curbing capital spending following the printing of an increase, when compared to the first half 2017, of 52% in its first half 2018 capital spending to US$228 million. Full year guidance for capital expenditure in 2018 is forecast to be US$525 million.
Net cash to 31 December 2017 came in at US$2.0 billion (excluding commitments of US$616 million in lease financing) compared to US$1.4 billion from a year earlier. The company holds a cash hoard of US$2.5 billion. Interest bearing liabilities fell to US$448 million over the same comparative period as net debt. We have no concerns over the structure of the company’s balance sheet.
Shareholders were greeted with a higher first half dividend and a special dividend. The ordinary dividend for the first half was increased to US4.3 cents per share from US3.6 cents per share for a year earlier. A top up special dividend of US3.0 cents per share was also declared, to bring the total dividend declared to US$7.3 cents per share. No special dividend was declared for the first half 2017. We consider the upbeat dividend payment reflects the Boards’ confidence in the company’s financial position and especially the balance sheet. The company also added US$250 million of additional share buyback funding, lifting the outstanding amount to be spent to US$540 million. We are supportive of buyback programmes as these programmes benefit present and future shareholders by lifting the share-based valuation metric, such as earnings per share, net asset backing and dividends per share both now and into the future.
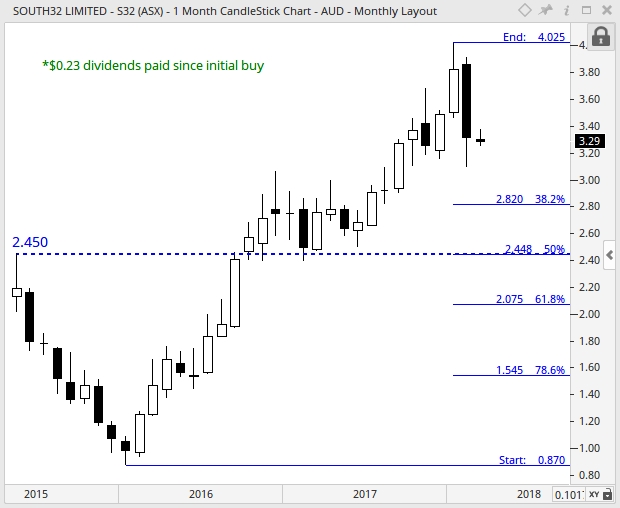
With reference to the monthly chart, prices have entered a corrective phase of the overall technical cycle after printing an all-time high of $4.03 in January. Should the bears maintain control over the near-term, then initial support is indicated $2.82, followed by $2.45. This consist of the 38.2% Fibonacci retracement, and a combination of the 50% Fibonacci retracement and structural resistance (horizontal dashed-blue line) respectively. In the grand scheme of things, the broader uptrend remains in play despite the softness in price-action that has been apparent of late. For this reason, we would categorise the recent period of weakness as both temporary and healthy. Therefore, once this pause in trend is complete, we would expect the longer-term bulls to reassert upward pressure, and thus, steer the prevailing direction of South32.
We believe the assets held in the company’s portfolio have the capacity to generate future value. The company’s assets have the requisite long-life and are being positioned toward the competitive part of the appropriate cost curves. The locations of the company’s assets in some of the resource rich pedigree regions of Australia, South Africa and South America is a genuine value add factor. This value proposition is further improved with the backing of a robust balance sheet and experienced management team.
No doubt, the first half result did not leverage off the full benefit of higher commodity prices reported over the first half 2018. The financials did however remain positive and a pristine balance sheet took another step to the better. With long-life and cost competitive assets and a financial capacity to deliver, warrants we believe supporting the stock.
Consequently, we continue to recommend South32 (ASX:S32) as a high conviction buy for Members with no exposure to the stock.
Disclosure: South32 (ASX:S32) is held within the Fat Prophets Mining and Resources, Concentrated Australian Share and Concentrated UK Share portfolios.

