
A Penny(tel) For Your Thoughts
MNF Group (ASX:MNF) reported strong underlying growth in its first half report with all business segments delivering. However, as management announced a relaunch of its Pennytel brand, they downgraded the full-year NPAT (net profit after tax) forecast from $15 million to $12.5 million. Today we weigh in on the results and the outlook going forward.
First Half Results 2018 (to 31 December 2017)
MNF Group (ASX:MNF) posted solid revenue growth in the first half of FY2018 (1H18), with sales up 27.6% year-on-year to $116.66 million, on the back of strong Global Wholesale (+34.2% yoy) and Domestic Retail business (+20.1%) growth.
Looking briefly at the breakdown, the Global Wholesale segment saw the largest spike as the business continues to benefit from the Point of Presence (PoP) program which makes its Telecom New Zealand International subsidiary the primary carrier for European and US Telcos seeking to expand in the Asia Pacific market as well as the recent expansion to Hong Kong. The PoP push has allowed this segment to now account for 73.2% of all revenues up from 69.6% last year and to contribute over 86.3% of the $25.25 million increase.
The Domestic Retail segment also reported solid growth, with sales up 20.1% year-on-year to $17.67 million as the Conference Call International (CCI) acquisition (previously covered) has proven to be accretive. This segment contributed 11.7% of total revenue growth in 1H18 with the remainder (2.0%) coming from the Domestic Wholesale business.
Going forward, the prospects for Domestic Retail look bright as the CCI subsidiary has been selected to provide NZ government agencies conferencing services.
In addition to that, management has stated that they will relaunch the Pennytel brand which will be focussed on the over 50s demographic in the mainstream retail market. Management’s strategy is to lead with a mobile product which re-sells access to the Telstra mobile network, then they will cross-sell broadband offerings once the brand is established. This foray will not be without costs though, which we will discuss in the Outlook section below.

Source: 13 February 2018 Company Presentation
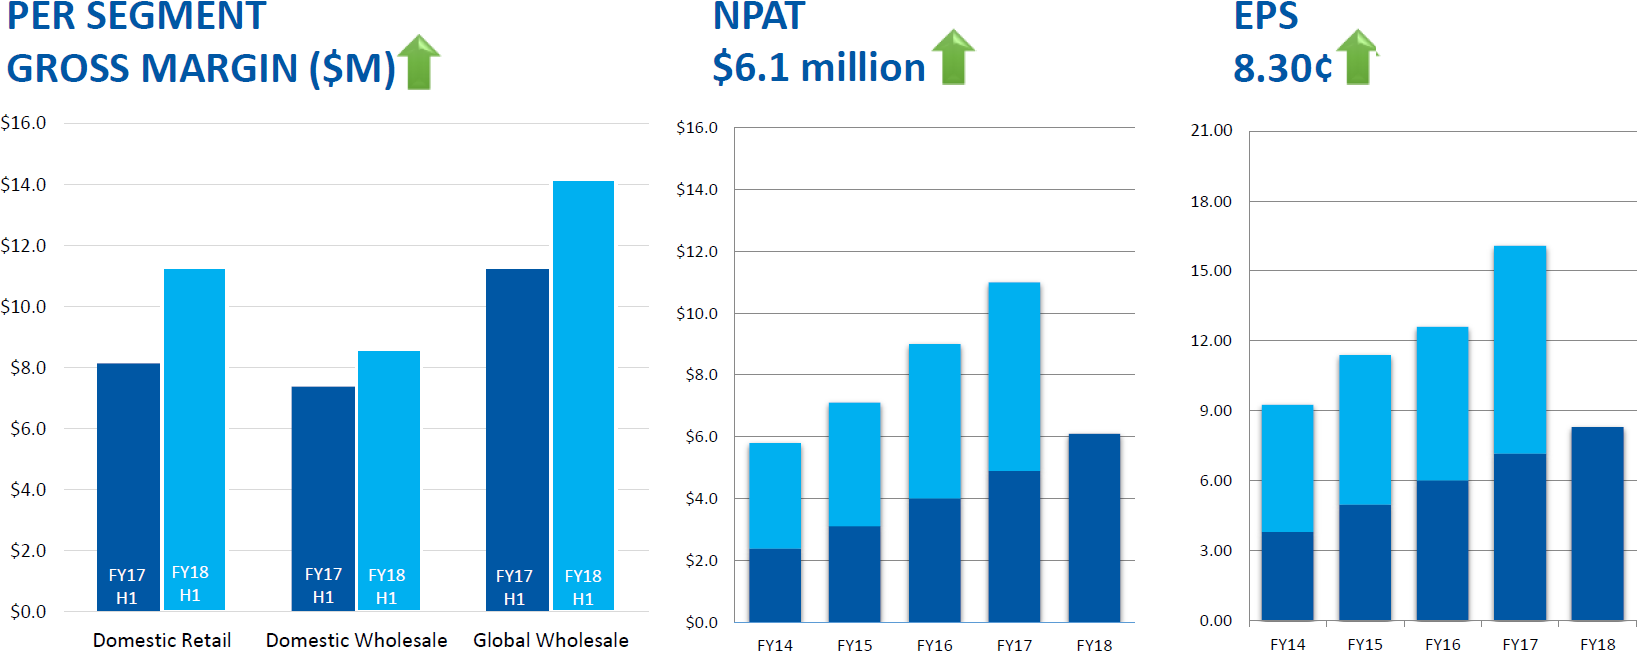
The robust revenue performance this period led to a strong growth in gross profit for the 1H18. Below we look at a brief breakdown across all three operating segments of the business:
First off, the Domestic Retail segment saw gross profits expand a significant 38.5% year-on-year to $11.27 million benefitting from the CCI acquisition while Small Business margins continued to grow offsetting the slight structural decline in legacy Residential products. In addition, management are optimistic that the recent deal with the NZ government will expand margins in the future. As of now, the gross profit margin (GPM) from this segment has improved 850 basis points to 63.8%.
Next, the Domestic Wholesalesegment’s gross profits grew 16.5% year-on-year from better product mix and organic revenue growth. Though the segment is relatively small (11.6%) revenues compared to the other segments, it hits harder for its size providing 27.6% of gross profits at $8.59 million with a GPM of 63.4%, up 690 basis points year-on-year.
According to management, the bulk of the increase was the result of strong growth in iBoss hosted services which surged 47% year-on-year. They expect faster growth in the 2H18.
Finally, the Global Wholesalesegment performed very well with a 27% year-on-year increase in gross profits to $14.2 million from organic growth on the top line. As mentioned above, this was mostly due to the PoP expansion though the GPM narrowed by 100 basis points to 16.6% as the product mix has moved towards lower margin packages.
Source: 13 February 2018 Company Presentation
On the cost side, operating expenses at the group level increased 27.5% year-on-year to $25.51 million. The increase in expenses reflects the higher costs following the integration of CCI as well as expense related to the relaunch of the Pennytel brand. The largest source (~53%) of expenses were Employee-related expenses, up 22.7% year-on-year which were followed by other expenses (~39.0%) up 45.3%.
Despite that, the strong top line growth still led to higher profits, with net profit after tax (NPAT) up 24.5% year-on-year to $6.05 million. Basic Earnings per share (EPS) increased 15.8% year-on-year to 8.30 cents while Diluted EPS increased circa 16% to 8.21 cents.
Outlook Updated
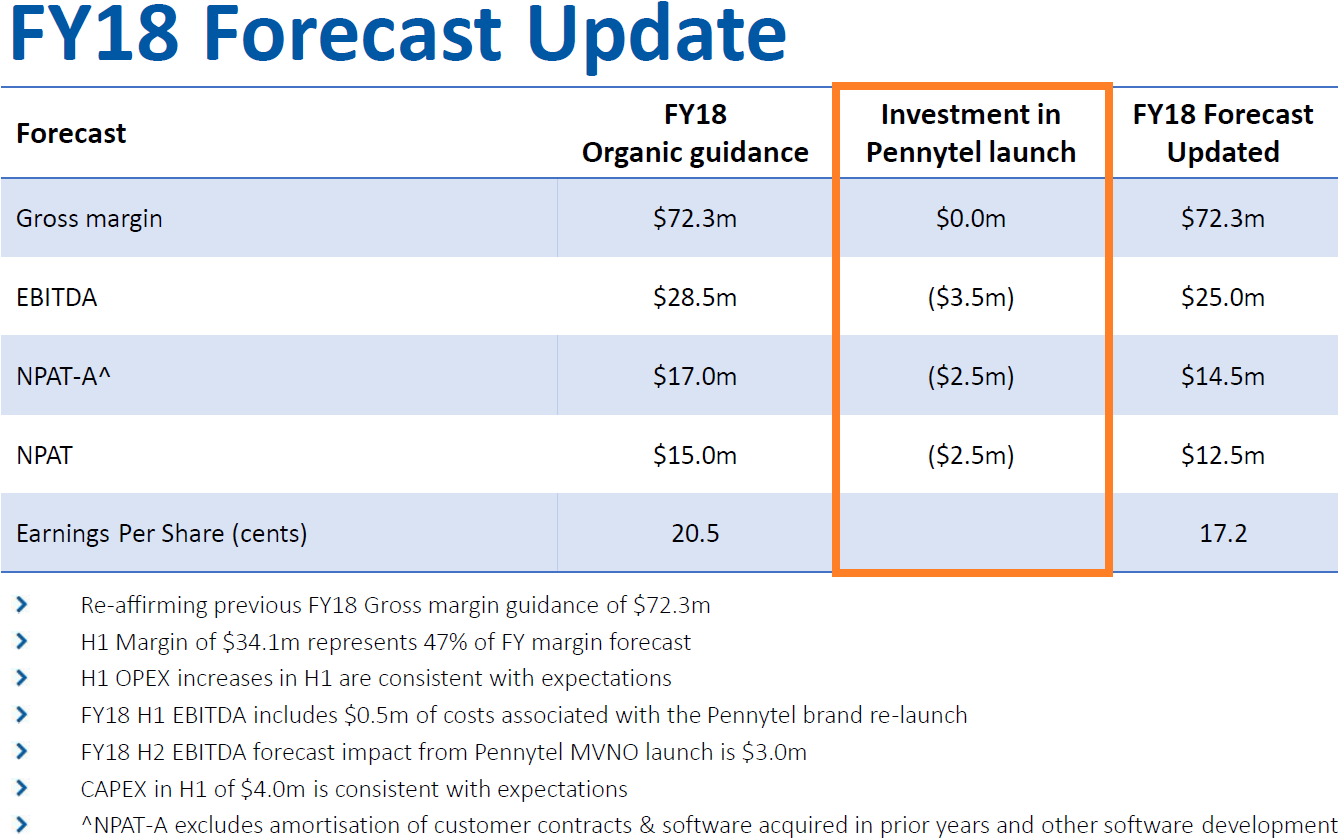
Given management’s announcement of the Pennytel relaunch, this is expected to negatively impact NPAT as summarised in the graphic below. Investment in this operation will cost the company circa $3.5 million and is expected to begin operations with some 9,000 subscribers by the end of the 2H18.
According to management, they will leverage the company’s extensive “software ecosystem” (another way of saying cross-selling activities) and ramp up subscribers to 150,000 by the end of 2019 and to 250,000 by 2020. By then, management expects this investment to contribute over $7.9 million in EBITDA.
Source: 13 February 2018 Company Presentation
Finally, management reiterated their stance that they will actively seek acquisitions to further spur on growth, though this is contingent on the right opportunity presenting itself. Nevertheless, the company has access to some $21.5 million in cash as well as $17.1 million in debt funding should management find an opportunity that fits their criteria.

Turning to the daily chart, prices have entered a corrective phase of the overall technical cycle after printing a high of $6.90 as marked by the horizontal red line. On the plus side, support was respected at the $4.89 region as shown by the horizontal dashed-blue line in mid-February, which is deemed positive price-action. Coupled with the relative strength index (RSI) also lifting from oversold territory, together have combined to alleviate the recent period of weakness in share price. Above, dynamic resistance is expected at the 50-day moving average (red line) of $6.02. Therefore, a sustained break above this indicator would bolster upward momentum, and likely be the precursor towards a resumption of the medium-term uptrend.
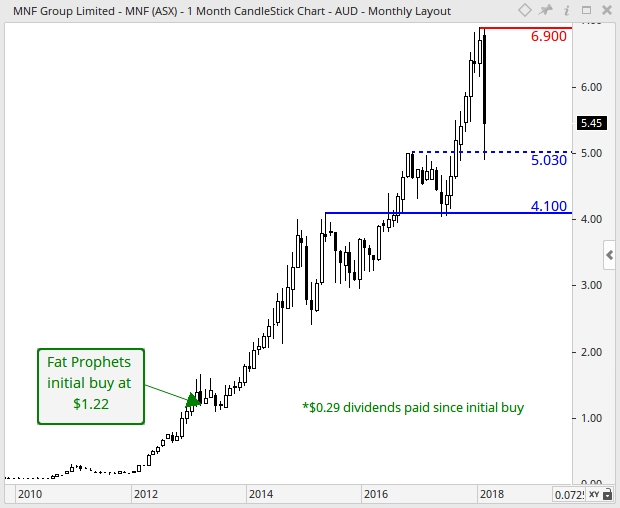
With reference to the monthly chart, structural support was recently respected during the month (i.e. February) at the $5.03 region as shown by the horizontal blue dashed-line, which is a positive development. In the grand scheme of things, a solid long-term uptrend remains intact as evident from the series of higher lows and higher highs since 2012. For this reason, the probability of a retest and an eventual challenge of the February intra-month all-time high of $6.90 as illustrated by the horizontal red line, is likely at some point. A definitive break above this key level of resistance would bolster broader term upward momentum, and send prices into blue-sky territory.
Summary
MNF Group’s 1H18 result announcement illustrates another successful period of organic growth for the company seeing significant improvements in both the top and bottom lines across the board. The relaunch of the Pennytel brand is likely to crimp near-term profits though due to start-up costs.
MNF Group (ASX:MNF) is currently trading on 27.1 times the FY18 earnings estimate, with this forecast to decline to 21.3 times in FY19. While slightly full (even allowing for conservative profit forecasts) these multiples are palatable in our view given the company’s solid track record of growth and first mover advantage in its niches.
Accordingly, MNF Group (ASX:MNF) will remain held in the Fat Prophets portfolio.
Disclosure: MNF Group (ASX:MNF) is held within the Fat Prophets Concentrated Australian Share and Australian Small & Mid Cap Models.

