
Turning it Around nicely
Estia Health (ASX:EHE) shares enjoyed a strong finish on the boards last week after reporting interim results, recouping much of the ground lost since late last year. The aged care provider declared its first interim dividend in two years and a mid-single digit increase in EBITDA. The company looks to be advancing its turnaround nicely under new senior management and should be a beneficiary of industry tailwinds.
Background
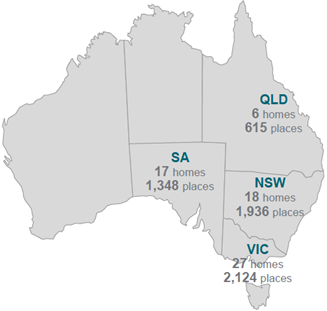
Estia Health (ASX:EHE) joined the portfolio in May 2017, and as a reminder to Members, the company is the owner and operator of aged care facilities in Australia, and had 6,023 operational places at the end of 2017. Estia has a wide geographical spread across the eastern states, with no presence in WA (and no plans to expand there) at present. Estia has a deliberate strategy of targeting higher income social economic metro areas. The company is therefore targeting its product at customers who are after a ‘higher’ level of service.
Source: Estia Presentation
Estia Health undertook a significant capital raising in FY17 to bolster its balance sheet and made some senior management changes.
The highly experienced and well-respected Norah Barlow had been installed as CEO after being a director. We hold her in high regard, as she had headed up NZ focussed Summerset Group, one of the most respected retirement village operators in Australasia. High profile agitator Dr Gary Weiss was also elevated to the role of Chairman a year ago, and we believe this has significantly strengthened the company’s management and oversight.
Acquisitions have taken a back seat in the short to medium-term, with the company focusing on refurbishment, greenfield and brownfield developments. We view this as a prudent approach and one that can lift value for shareholders. And the fact that the company has already returned to paying an interim dividend suggests this is already beginning to bear fruit. Overall the interim results were solid enough to suggest the turnaround is progressing adequately.
1H18 snapshot
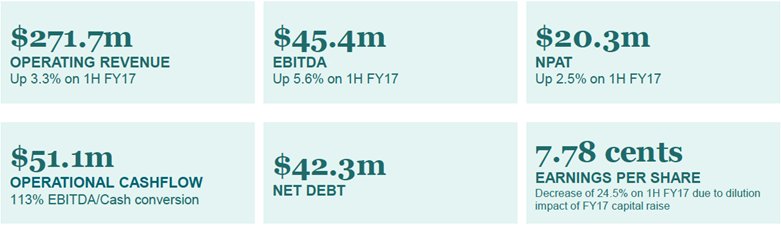
Total revenues edged up 3.3% to $271.7 million, while the full year net profit after tax (NPAT) to 31 December 2017 increased 2.5% to $20.26 million. A non-cash one-off impairment charge associated with the Southport home demolition and rebuild decreased NPAT in the period.
Basic earnings per share of 7.78 cents though was down 24.5% year-on-year due to the dilution from the FY17 capital raising. EBITDA before gains on sale of assets held for sale was up 5.7% to $45.4 million. The non-cash one-off impairment charge associated with the Southport home demolition and rebuild is not included in the EBITDA calculation.
Operating revenues rose 3.3% to $271.7 million with increased revenue per operating bed day.
Total revenue per operating bed day edged up from $260.2 in 1H17 to $265.1 in 1H18. The company announced a fully franked interim dividend payment of 7.8 cents compared to no dividend a year earlier.
Source: Company Presentation
A focussed effort has also seen occupancy levels lifted from a couple of years ago, and in 1H18 occupancy in existing homes was 94.0%, up from 93.0% in 1H17. We expect this to rise further as the company engages in a material refurbishment program. Some 15 homes are currently undergoing refurbishment out of a total of 68 operational homes as at the end of 2017. The facilities upgrade should also be pivotal in lifting margins in our view.
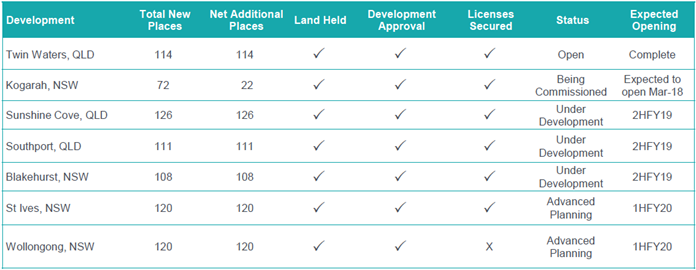
In terms of new homes, the Kogarah (72 beds) greenfield development is due to open in March 2018.
A further 3 homes are in development in Blakehurst (NSW), Southport (QLD) and Sunshine Cove (QLD), which will add a further 345 beds. St Ives and Wollongong are in final planning stages. The following table shows the pipeline through to FY20.
Source: Company Presentation
The company has also made progress on controllable costs as well, with non-wage expenses (excluding facility rentals) falling by $3.90 per bed from a year ago to $44.60 in 1H18. As a percentage of revenue, these costs have fallen from 18.6% in 1H17 to 16.8%.
Staff costs though have edged up, from 64.0% of revenue in 1H17 to 65.6% in 1H18. A need to maintain a quality service and wage pressures pose a challenge to wringing out efficiencies on this front. The opening of Twin Waters in Queensland in September 2017 added to staff costs.
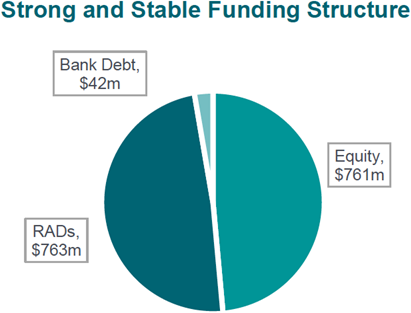
Following a $136.8 million capital raising in FY17, strong operating cash and RAD (refundable accommodation deposit) inflows, Estia’s balance sheet has been transformed compared to where it was a year ago. At just $42.3 million, Estia’s net debt is less than a quarter of what it was 12 months earlier ($181.1 million) and less than half of the $102.3 million it was at 30 June 2017. The company’s gearing range has fallen to around 0.5 times, well below the target range of 1.5 – 1.8 times. Undrawn debt facilities were in place to the tune of approximately $270 million.
At 30 June Estia was funded roughly 48.5% through equity, 3% percent through net debt and 48.5 percent through RADs.
Source: Company Presentation
We view the interim result as a solid one, building on the foundation that emerged in FY17 for sustainable earnings growth.
Regulatory risks are of course present with Estia given the industry, but the government as management states, will always need to balance “the needs of an ageing population [and the country’s finances] with the expectations of the community.” Resident contributions are slowly expected to form an increasing part of the mix in the years ahead.
The industry has also been under the spotlight in the media, with various exposes. This has also meant that any incidents tend to grab column inches and Estia has not been immune to them as we highlighted in prior coverage. The company though has made it clear it doesn’t condone any such behaviour though, and these are likely isolated, albeit sad incidents, rather than any problem with Estia’s culture or quality of employees in our view.
Overall, the underlying thematic remains a compelling one. Australians are living longer, and many baby boomers are set to retire over the next two decades, increasing the demand for high quality aged care services.
This is particularly as studies show that most retirees will need to cash up equity in their own homes, and move into care to sustain themselves in their golden years.

Source: Company presentation
Outlook
In terms of the outlook for the full year, the company reaffirmed FY18 guidance of mid-single digit percentage growth in EBITDA subject to no material change in market or regulatory conditions.
RAD inflows are forecast to be positive, both from new beds and the continued differential between incoming and outgoing RAD/bond prices. The target gearing ratio is maintained at 1.5 times to 1.8 times EBITDA, providing plenty of headroom for expansion.
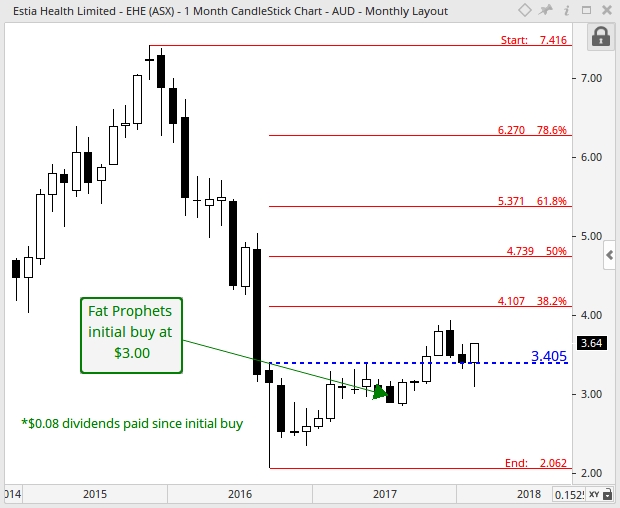
Turning to the charts, and on the monthly, the share price of Estia Health touched an all-time low of $2.06 in September 2016 to form a ‘bullish doji’ candlestick formation. Positively, the highest price of this candle of $3.41 was surpassed in October 2017. This is a bullish development and signals a medium-term upward shift in momentum. Consequently, as we look ahead the probability now swings towards an eventual ascent in share price towards the next band of resistance evident between $4.11 and $4.74. This is made up of the 38.2% and 50% Fibonacci retracement levels respectively.
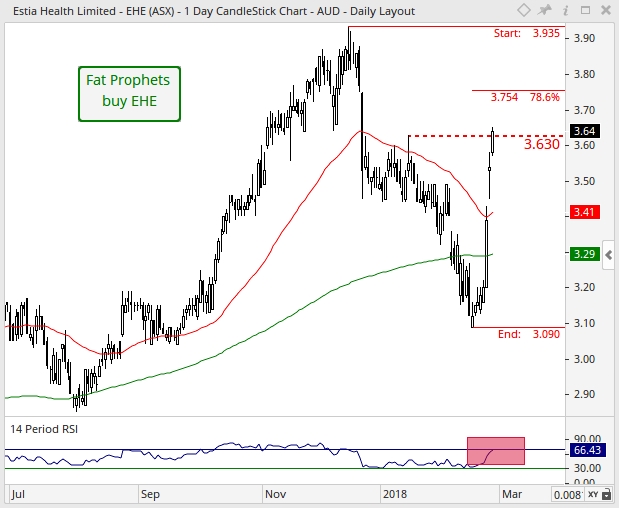
Turning to the daily chart, and as a result of the stern increase in share price this has resulted in the RSI to rise within range of overbought territory (exhaustion of short-term upward momentum). Hence, should the bears emerge over the near-term, a temporary pullback in price could follow. Positively, should this occur, we would view this short-term pause as corrective, as the underlying impulsive move north remains firmly intact. In the grand scheme of things, prices have cleared both the 50 (red line) and 200 (green line) day moving averages, which is suggestive of momentum to have swung north. Therefore, and over the medium-term time horizon, an eventual upward rotation towards resistance located at the December 2017 high of $3.94 is deemed to be the likely path, moving forward.
Summary
We believe that the turnaround at Estia is progressing and the company is well placed to lift value for shareholders under new senior management, with a stronger balance sheet and supportive industry tailwinds, despite some regulatory uncertainty and adverse industry press.
Estia Health (ASX:EHE) shares are trading on a FY18 earnings multiple of approximately 21 times, offering a yield of 2.6%.
Estia Health will remain in the Fat Prophets portfolio. For Members without exposure we recommend the shares as a buy around current levels.
Estia Health (ASX:EHE) is on our conviction buy list.
Disclosure: We hold Estia in the Concentrated Australian, and Small & Mid-cap managed account portfolios.

