
A Home run in the First Half
Investment platform provider, Praemium (ASX:PPS) has not escaped the recent sell-off, with the stock giving back this year’s gains after a strong run. This also likely reflected investors view of the operating leverage that the company possesses to the broader market. With volatility subsiding, the company’s half year results last week have provided a useful health check. Indeed, these show that Praemium continues perform handsomely, hitting milestone after milestone and benefitting from a confluence of positive factors.
Recap
In our previous coverage of Praemium (ASX:PPS) back in January (FAT-AUS-855), we noted that the company was well placed for 2018, having reported record inflows and hitting numerous milestones along the way. This is also helped by a mix of factors including compulsory superannuation contributions, technology disruption caused by Praemium’s innovative offerings, as well as the shift away from larger-scale wealth management firms.
Since then, the most relevant development has been the release of the company’s interim results. These have been announced in the middle of a broader market sell-off and in our view Praemium’s recent share price weakness is no reflection of how well the company continues to perform operationally.
1H18 Interim Results (to 31 December 2017)
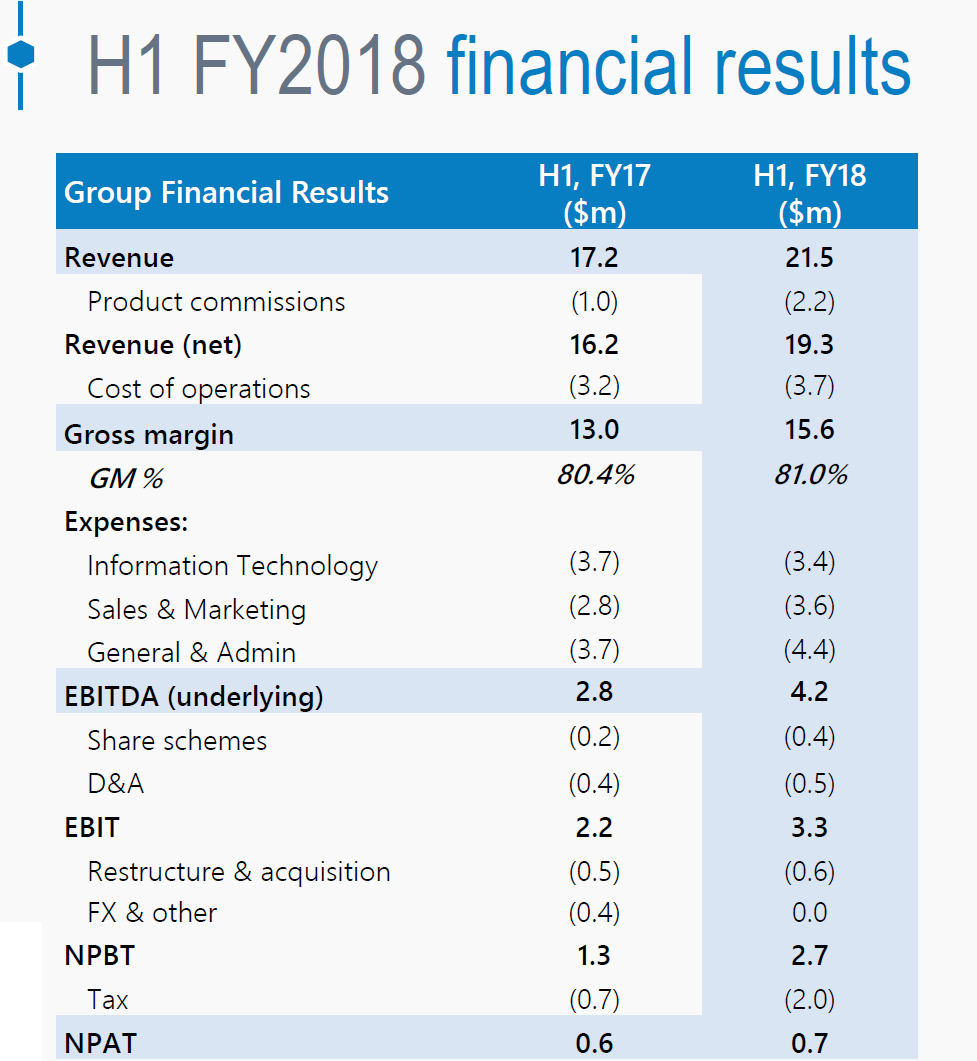
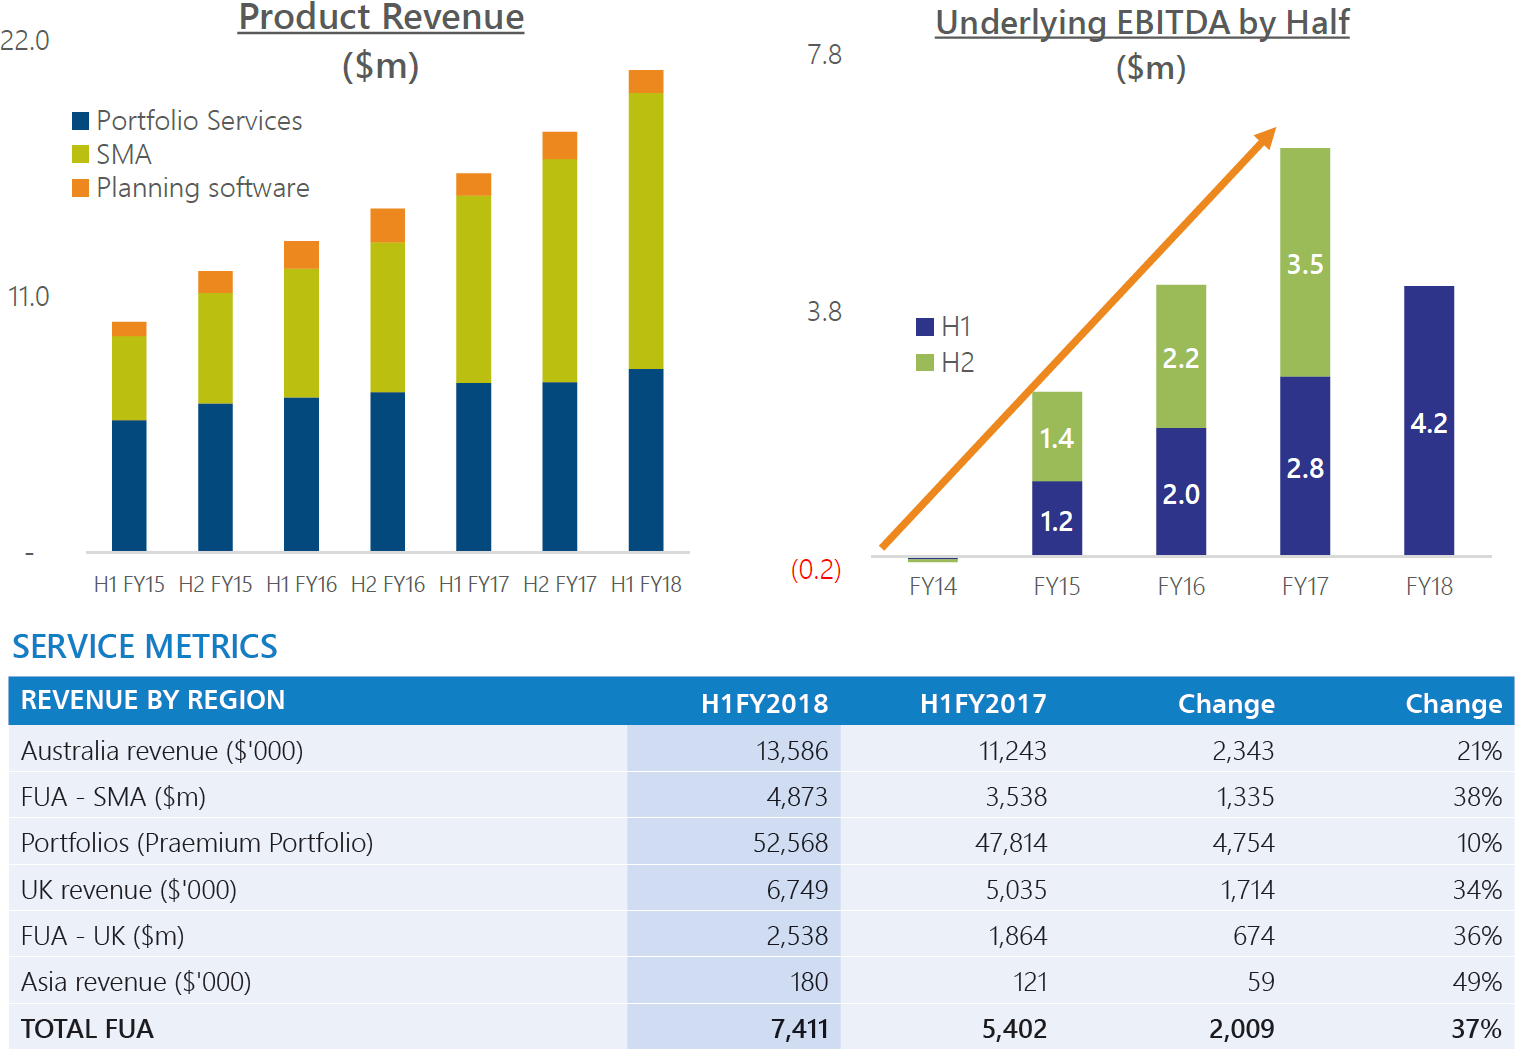
Starting with the topline, Revenues for the 6-month period to 31 December 2017 (1H18) increased 25% year-on-year to $21.5 million. Management notes that there was growth across all product lines, but the continued strength in the Separately Managed Accounts (SMA) platform remains the standout, with revenues up 47% year-on-year to $11.8 million on strong funds inflow and higher margins in the in-house investment management unit. This also compares well against the modest growth in Portfolio services (+8% yoy) and Planning Software (+2%).
In our view, some of the key marketing and operational innovations Praemium has implemented to support their wealth management clients include the launching of (i) digital acceptance for SMA account opening; (ii) international models for the Australian SMA and (iii) admin services for non-custodial clients.
Source: 10 February 2018 Company Presentation
Looking at revenue breakdown across regions and starting with Australia, revenue growth continued its momentum in first half, having increased 21% year-on-year. As noted above, the main driver was the record growth in inflows to the SMA platform which surged 44% year-on-year while the Portfolio Services record a more modest 8% increase over the same period.
In overseas operations, in the UK, turnover rose 34% year-on-year as both revenues streams (SMA platform and Investment Management income) benefitted from strong inflows. Funds under administration (FUA) were up 36% year-on-year to $2.54 billion bringing overall FUA to $7.4 billion, up 37% year-on-year. Asia revenues were up 49% year-on-year but this was mainly due to a much smaller base of $121k growing to $180k.
Turning to the EBITDA line, Australia continues to carry the loss-making international operations having brought $5.7 million compared to last year’s $4.8 million, up 19% year-on-year. On a positive note, the growth in UK’s revenues resulted to a 43% year-on-year reduction in EBITDA losses to $0.4 million with management expecting a positive contribution in the 2H18 given the prevailing trends.
In Asia, with the testing phase of the Hong Kong-based customer relationship management project completed, EBITDA loss decreased by 18% year-on-year to $0.6 million. Going forward, management noted that profitability in Asia is set to improve significantly with the reduction of the R&D cost base and recurring licence revenues expected to support profitability.
EBITDA margins at the group level also considerably improved, up to 21.8% compared to last year’s 17.3%.
Source: 10 February 2018 Company Filing
Operating expenses at the group level came in at $17.3 million for the 1H18 which was noticeably higher compared to last year’s $14.4 million. A closer look shows that this was largely driven by the growth in the FUA which significantly impacted Cost of Goods Sold which included commissions for the Smartfund 80% Protected product line.
Looking at international operations, starting with the UK, operating costs slightly increased to £3.5 million for 1H18 compared with the £3.3 million in the 1H17 though the faster pace of growth in the top-line contributed to an EBITDA improvement of 43% (44% in GB£). Meanwhile, the ongoing restructuring of the Asian operations cost base has been completed, which should drive an improvement in results in the 2H18.
Going forward, management also noted that in order to maintain momentum in the SMA platform, they continue to invest in growth, having increased headcount in R&D and Sales & Marketing up 15% and 25%, respectively. They have also allocated $600,000 in R&D investment in proprietary technology to expand the platform offerings for the first time.
We are also encouraged that net revenue growth over the past 3 years has significantly outpaced expenses, with a compound annual gain of 36% versus 13% for expenses. If the past is any indication and especially with their prudent investments, we expect growth to continue at a decent clip going forward.
Consequently, from all the improvements noted above, consolidated NPAT for the half year to 31 December 2017 improved from $525, 670 to $724,560, an improvement of 25.9% year-on-year. Overall, we are pleased with the company’s trading performance at the interims though.
Moving on to the balance sheet, the company remains debt free with a net asset position of $18.5 million and with a cash hoard of $9.7 million (+18.3% yoy) as at 31 December 2017. Comparing it to 30 June 2017, the cash position has increased by $700,000 due to an increase in cash collection activities.
Also, another key highlight in our view is that operating cashflow increased from $0.128 million to $1.871 million (+1,362%) as a result of the EBITDA growth. This significant improvement means that Praemium (ASX:PPS) can fund more of its growth internally going forward.
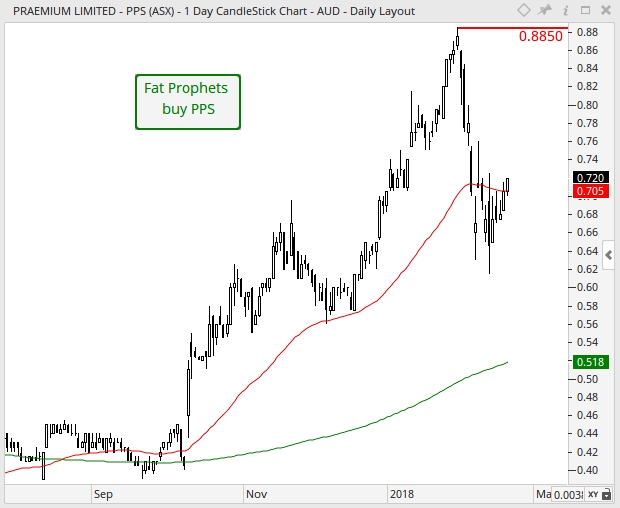
Turning to the charts, and on the daily, prices have recently broken above the 50-day moving average (red line) of $0.71 as dynamic resistance. This is a positive event, which swings short-term momentum back in favour of the bull-camp. If our analysis is correct, then an eventual retest of overhead resistance sighted at the January high of $0.89 (horizontal red line) would potentially be on the horizon. Furthermore, from a medium-term momentum perspective, this remains in favour of the longer-term buyers, as backed by the bullish moving average crossover present since August 2017. This occurs, when the 50-day moving average (red line) crosses above the 200-day moving average (green line).
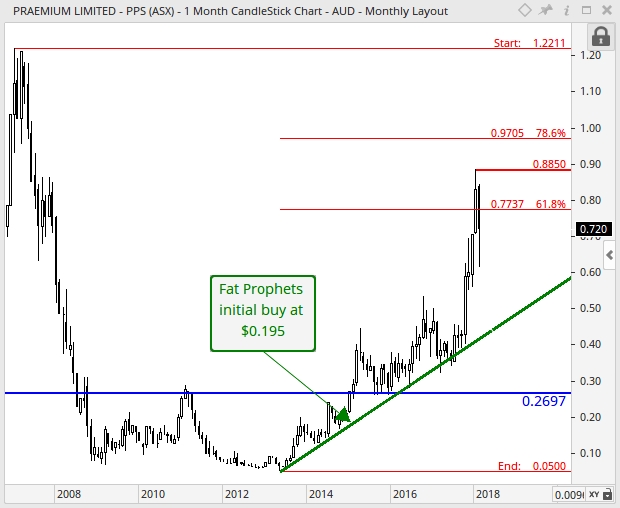
With reference to the monthly chart, structural support was respected at the $0.27 region (horizontal blue line) in late 2015, and coupled with dynamic support being respected at the long-term uptrend line (upward sloping green line), together has led to a stern upward trajectory in share price until January. Despite the recent set back in share price, long-term momentum remains favoured to the upside, as evident from the series of higher lows (i.e. troughs) and higher highs (i.e. peaks), which are characteristics of a dominant broader term uptrend in play. Above, a band of overhead resistance is evident between $0.77 and $0.97. This is made up of the 61.8% and 78.6% Fibonacci retracement levels respectively. Therefore, once this pause in trend is complete over the short term, this price range would likely be the focal zone of reference moving forward.
Summary
In a nutshell, Praemium’s 1H18 financial performance continued to be impressive, exhibiting improvements across all regions which we believe augur a solid finish for FY2018. We also expect further growth in the bottom-line as international operations are reaching a critical mass and set to deliver profits (or at least breakeven) by the end of the year.
The Australia business is also set to deliver more growth by capturing a larger share of the wealth management market with its increased investment offerings, adding new asset classes like term deposits and further expandang its range of international model portfolios. International operations are also expected to grow via acquisitions of books of business while Praemium is also seeking approval to promote Smartfunds in the Middle East.
On a valuation front, the shares are currently trading on a FY19 earnings multiple of 60 times, falling to 30 times in FY20. These are admittedly lofty metrics but the company’s scale is growing at a rapid clip and a high degree of operating leverage has the potential to deliver substantial shareholder gains over the medium to longer term.
Accordingly, we maintain our BUY rating for Members without exposure, and who are prepared to take a medium to longer-term view.
Members are reminded that the company’s shares are thinly traded, so patience should be exercised when building a position.
Disclosure: Praemium (ASX:PPS) is held within the Fat Prophets Concentrated Australian Share and Small/Mid-Cap Models. The Praemium platform is also used by Fat Prophets Wealth Management.

