
Long-term tailwinds
The interim results from Australia’s largest private health insurer Medibank Private (ASX, MPL) were positive in our view, with a solid improvement in operating profit from the core health insurance operations. The group has a market leading position, with a favourable long-term thematic due to an aging and growing population and we continue to rate it a buy.
Affordability remains a headwind for the industry, but Medibank is mitigating this through cost-out initiatives.
We believe there is more scope for privatisation productivity gains and the company’s ‘ahm’ brand has been winning market share in the more ‘affordable’ segment of the market opportunity. The Federal Court’s dismissal of proceedings taken by the ACCC against the company last year for alleged misconduct towards customers was a positive and the shares are trading relatively close to all-time highs despite the broader sell-off seen in equity markets in early February.
According to management the current year will see growth firmly on the agenda. Chief executive Craig Drummond stated, “2018 marks a step change for Medibank. We are now positioning for growth which will allow us to leverage our scale to build the core business and transform into a broader health services company. Our progress means we are now in a position to pursue new initiatives, continue to invest in our chronic disease management programs and expand our in the home programs.”
1H18 snapshot
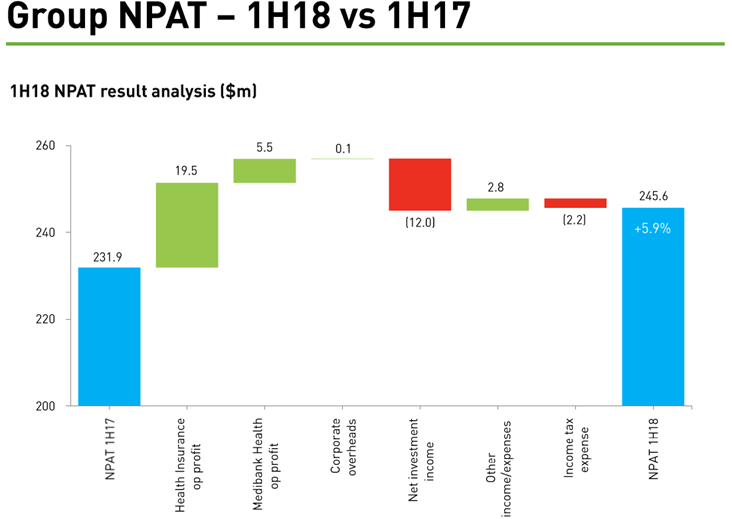
Group 1H18 net profit after tax (NPAT) increased 5.9% year-on-year to $245.6 million, as solid results from the core health insurance operations more than offset lower net investment income and higher income tax expense. The following ‘waterfall chart’ highlights the key factors driving the variability in NPAT between the two periods under review.
Source: Medibank Private
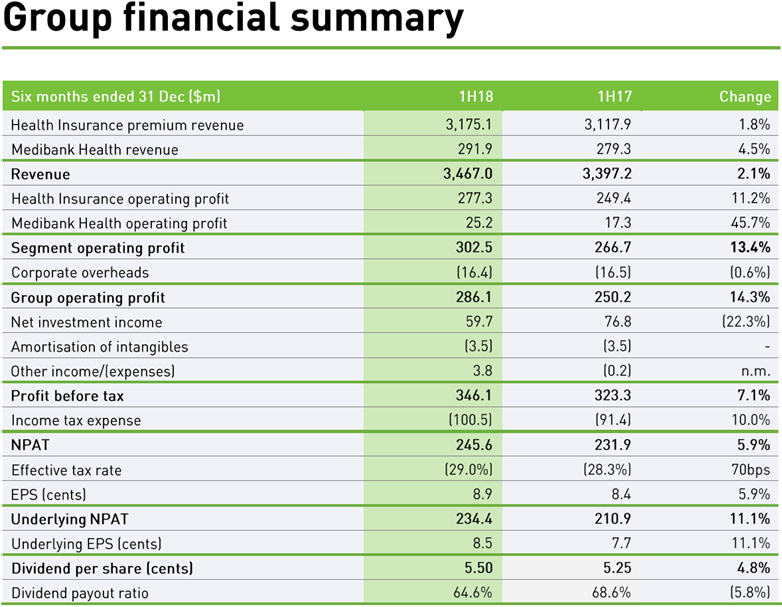
The company’s interim dividend of 5.5 cents per share fully franked, reflects a 4.8% increase from a year earlier.
The interim dividend represents a payout ratio of 64.6% of underlying NPAT as underlying earnings per share came in at roughly 8.5 cents per share in 1H18, up 11.1% year-on-year. The Board of the company has a targeted payout ratio between 70-80% of annual underlying NPAT. For the full year, the payout is expected to be “towards the top end” of the target range.
Medibank Health Insurance premiums increased 1.8% year-on-year to $3,175.1 million.
Industry growth continues to slow, reflecting “the challenging affordability conditions being experienced.” While this is modest growth, we expect inflationary pressures to flow through long-term and plans are in place to raise premiums by 3.88% from 1 April 2018.
The Medibank brand delivered an improvement in the acquisition rate and a lower lapse rate, reflecting the solid performance of new products. Brand share loss slowed again in 1H18. The ‘budget’ ahm brand continued to show decent growth in its acquisition rate, partly offset by a higher lapse rate. Market share for ahm was up solidly.
Medibank Health revenues were up 4.5% year-on-year to $291.9 million, for combined revenue growth of 2.1 percent to $3,467.0 million.
Source: Medibank Private
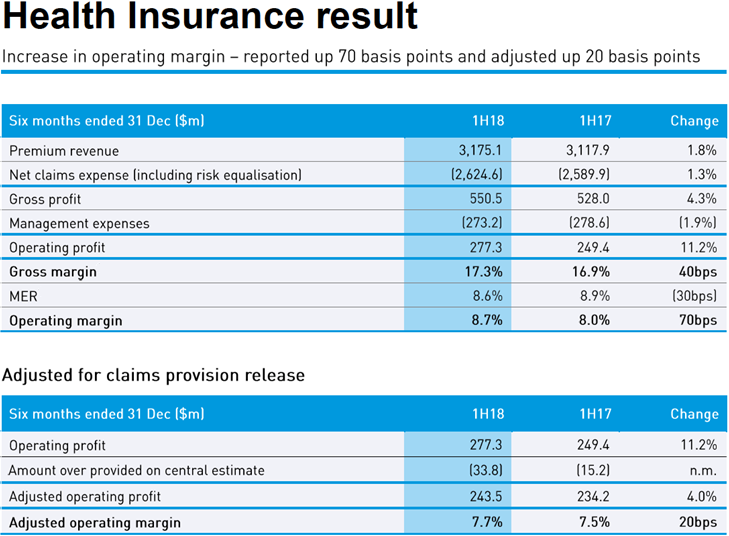
The Group impressed on the profitability front, leveraging the modest revenue growth into double-digit growth in operating profit. Looking at the Health Insurance segment, net claims expense (including risk equalisation) were up 1.3% to $2,624.6 million for 1H18.
Management expenses dipped 1.9% to $273.2 million, resulting in the MER (management expense ratio) falling 30 basis points to 8.6%. Higher depreciation and amortisation charges were more than offset by a 3.4% decline in operating expenses. The cost out story continues to support the bottom line, as IT and call centre services in the core business have been streamlined. This is necessary due to the affordability challenges of private health care insurance for many Australians.
The segment operating profit margin came in at 8.7%, up 70 basis points from a year earlier. Health insurance operating profit came in at $277.3 million, up 11.2% from 1H17. After allowing for a claims provision release of $33.8 million, the adjusted operating profit in 1H18 of $243.5 million marked a 4.0% increase on the comparable 1H17 adjusted operating profit.
Source: Medibank Private
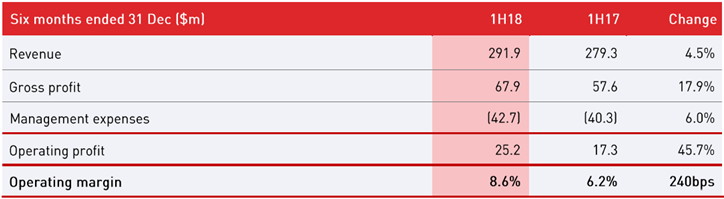
Medibank Health operating profit surged 45.7% to $25.2 million.
This was driven by the higher revenues, an improvement in operating performance across the segment, the acquisition of HealthStrong and a larger contribution from the group’s diversified insurance business. Management expenses increased, with this related to additional costs linked to HealthStrong and investment in the business, partly offset by lower depreciation and amortisation expense. The operating profit margin for the segment improved 2.4 percentage points to 8.6%.
Medibank Health result
Source: Medibank Private
Investment income was materially lower, falling 22.3% to $59.7 million. This was driven by lower returns from equity and debt instruments, along with a “more defensive portfolio positon.”
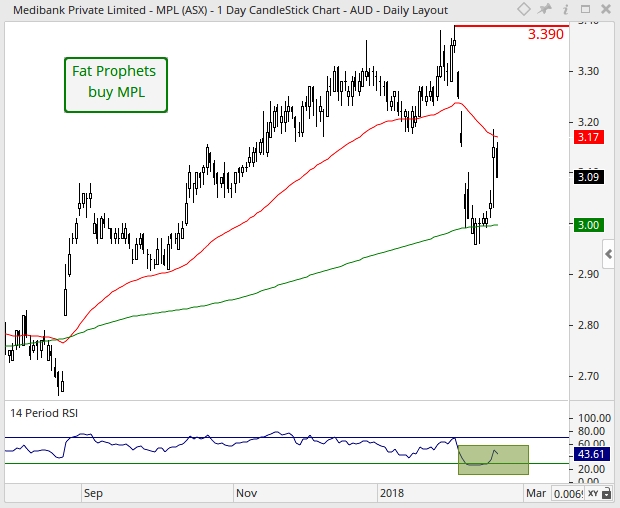
Turning to the technical picture and on the daily chart prices have entered a corrective phase of the overall technical cycle after printing a recent high of $3.39 on the 1st February as shown by the horizontal red line. On the plus side, support was respected at the 200-day moving average (green line) of $3.00, which is a positive development. Coupled with the relative strength index (RSI) also lifting from oversold territory, this has together combined to alleviate the recent period of weakness in share price. Dynamic resistance is expected at the 50-day moving average (red line) of $3.17. Therefore, a sustained break above this indicator would bolster upward momentum, and likely be the precursor towards a resumption of the medium-term uptrend.
With reference to the monthly chart, and after printing an all-time high of $3.32 in May 2016, a sharp correction followed. Positively, a ‘bullish hammer’ which is a type of candlestick formation had evolved in November 2016. Therefore, a decisive break above the ‘bullish hammer’ of $2.60 has evolved, which has resulted in a broader term bull-rotation. Looking forward, prices have closed (on a monthly-basis) above the 78.6% Fibonacci retracement of $3.12 (red set of retracements) in November 2017. This is a bullish development, as an activation of the next broader term upside target of $3.58 is triggered (127.2% Fibonacci extension).
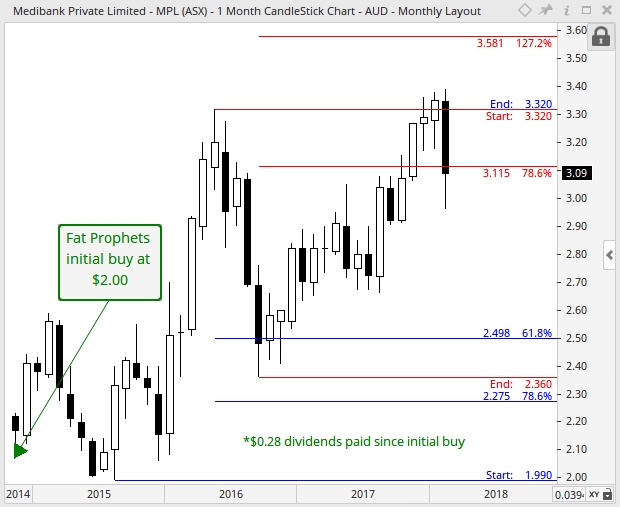
Despite the recent set back in share price, long-term momentum remains favoured to the upside, as evident from the series of higher lows (i.e. troughs) and higher highs (i.e. peaks), which are characteristics of a dominant broader term uptrend in place.
Summary
It was quite a roller coaster ride for Medibank in 2017, which faced a courtroom battle with the ACCC and some headwinds in the Private Health Insurance industry. The 1H18 results have impressed though, with double-digit increases in operating profit from the core health insurance business. While it hasn’t all been smooth sailing, we believe the company’s strong market position and solid long-term thematic of an aging and growing population needing healthcare coverage will see it navigate the challenges adequately and continue to deliver decent results for shareholders.
We continue to recommend the stock as a Buy for Members with no exposure.

