
Fat Prophets take some profits
Shares of Funeral services provider, InvoCare (ASX:IVC) sold off yesterday despite posting solid double-digit growth in operating earnings per share and boosting its dividend. We continue to like several characteristics of the Invocare investment proposition. However, the deterioration in the technical picture at the same time the company has advanced profits indicate it is getting increasingly difficult to meet investor’s expectations. Given strong gains since our initial buy recommendation we believe it is time to take part profits.
InvoCare’s business has defensive characteristics that are attractive to investors, especially during periods of volatility. Due to the nature of demand for its services, the company has a resilient revenue profile and good cash flow generation. It has supplemented its solid core business with acquisitions, a transformational one of which was the purchase of Bledisloe’s Australian and New Zealand operations for an enterprise value of more than $100 million.
At the time of its 2017 results announcement, management warned operating earnings per share were likely to be flat in the 2018 financial year as the company continues to reinvest back into the business. Given a still relatively lofty valuation, the weaker technical picture and already solid capital appreciation and dividends since our initial buy recommendation, we believe it is time to take part profits. We recommend Members sell-half their Invocare holding around current levels.
FY17 snapshot
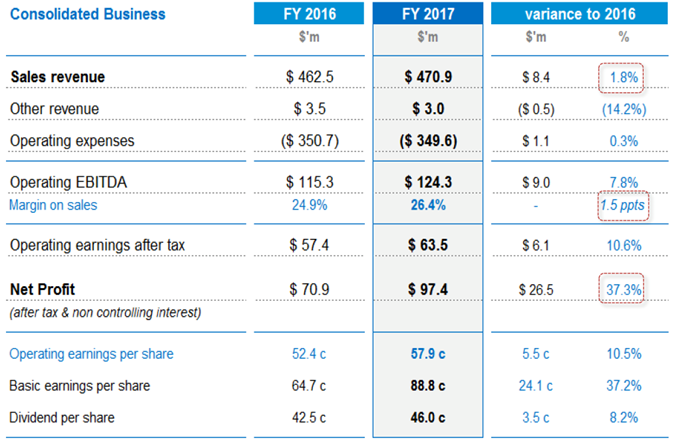
Normalised group sales in 2017 increased $8.4 million, or 1.8% to $470.8 million, driven by a combination of higher average funeral contract sales and more memorialisation sales in the cemeteries and crematoria business.
Overall, the number of deaths in Invocare’s core markets increased by approximately 1.7% compared to 2016 and the company’s market share attrition slowed in the second half of the year. In 2H17 market share was down 90 basis points on a rolling 12-month basis, against a decline of 130 basis points on a rolling 12-month basis as at June 2017. That was despite some branding and optimisation work across the network that saw some sites off-line for refurbishment. Invocare’s funeral case average (average price per funeral) increased 3.1%, exceeding inflation.
Reported group operating earnings before interest, tax, depreciation and amortisation (EBITDA) increased 7.8%, or about $9.0 million year-on-year to $124.3 million. The EBITDA margin improved roughly 1.5 percentage points to 26.4%.
The improved EBITDA margin reflected operating leverage and cost containment, which offset the slight erosion in market share. In local currencies, Australia and New Zealand posted strong EBITDA growth, while Singapore recorded a decline due to the temporary closure of parlours in 4Q17.
Improvement in the group EBITDA margin occurred in both halves of the year. Group operating expenses of $349.6 million in FY17 represented a $1.1 million, or 0.3% decrease from a year earlier. Invocare (ASX:IVC) maintained a strong cash conversion rate of 91%, flat with 2016.
Group operating earnings after tax increased $6.1 million, or 10.6% year-on-year, to $63.5 million.
The improvement was driven by the higher EBITDA and lower financing costs offsetting the impact of a slightly higher effective tax rate.
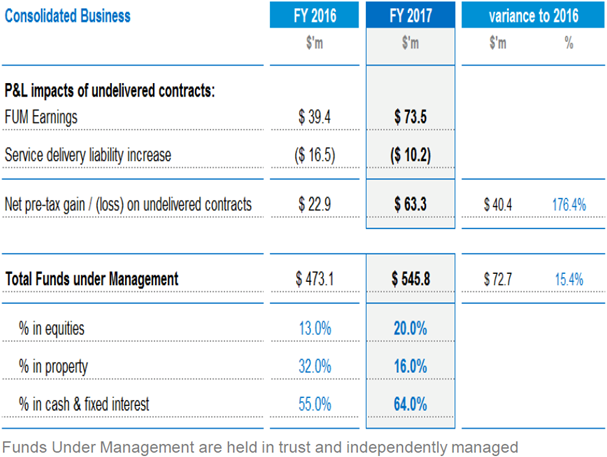
Consolidated net profit after tax (NPAT) attributable to ordinary equity holders surged 37.3% year-on-year to $97.4 million in FY17. The jump in NPAT was driven by a $39 million jump year-on-year in the net gain on undelivered prepaid contracts. Appreciation in the value of property investments held by the Guardian Trust funds, along with gains made on the sale of a commercial property were the primary drivers.
Source: Invocare (ASX:IVC)
Reported NPAT equated to earnings per diluted share of 64.6 cents, up 36.2% from FY16. InvoCare declared a fully franked final dividend of 27.5 cents per share taking the total ordinary dividend of 46.0 cents for the full year, representing an 8.2% increase from FY16.
InvoCare has been expanding its prepaid funeral operations. These benefit the company by locking in customers and expanding funds under management (FUM).
At the end of the year, prepaid contract funds under management (FUM) had swelled 15.4% to $545.8 million.
Mark to market changes can result in significant volatility in InvoCare’s statutory reported profit.
Prepaid contracts sold exceeded redemptions by about 11%.
Source: Invocare (ASX:IVC)
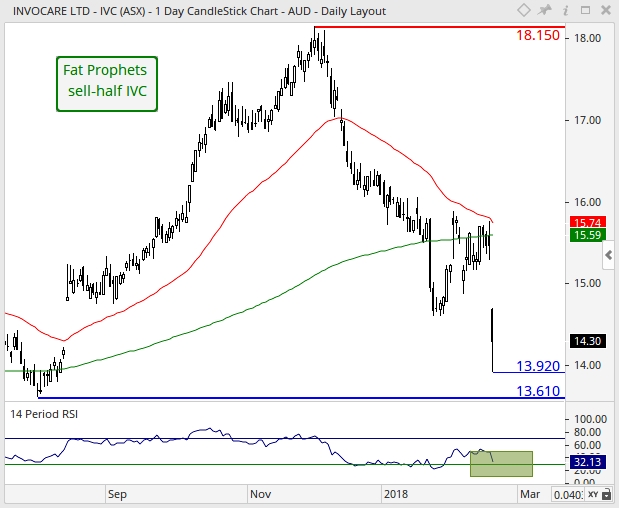
Turning to technical picture and on the daily chart a zone of support is evident between $13.61 and $13.92, should downside pressure mount over the near term. This is made up of the August 2017 low (horizontal solid-blue line) and the February intra-month low (horizontal thin-blue line) respectively. For the short-term technical landscape to improve, a sustained break above the 50-day moving average (red line) of $15.74 is required. If this favourable scenario was to unfold, then momentum would be confirmed to have rotated north, and thus increase the probability of an eventual test of overhead resistance situated at the November 2017 high of $18.15 as marked by the horizontal red line.
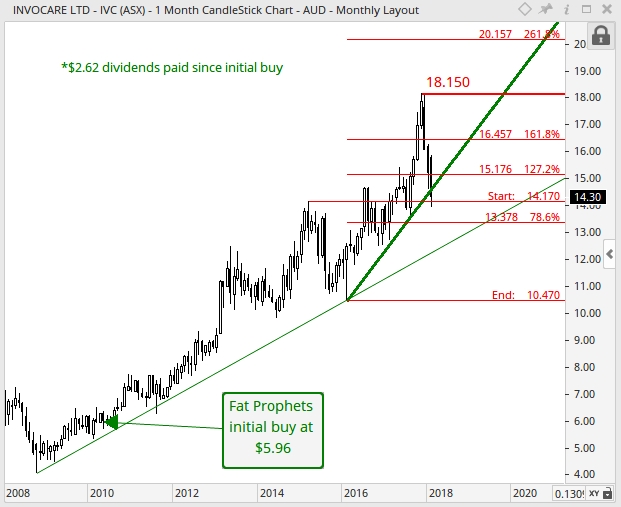
Regarding the monthly chart, prices have closed (on a monthly-basis) above the 78.6% Fibonacci retracement of $13.38 in July 2016. This is a bullish development and has activated three additional longer-term upside targets. The initial target of $15.18 being the 127.2% Fibonacci extension has since been achieved, along with the 161.8% Fibonacci extension of $16.46. Overall, this now leaves the 261.8% Fibonacci extension of $20.16 as the next broader term focal point of resistance. Despite the recent set back in share price, long-term momentum remains favoured to the upside, as evident from the series of higher lows (i.e. troughs) and higher highs (i.e. peaks), which are characteristics of a dominant broader term uptrend in place.
Summary
InvoCare’s business has defensive characteristics that are attractive to investors, especially during periods of volatility. Due to the nature of demand for its services, the company has a resilient revenue profile and good cash flow generation.
However, at the time of its 2017 results announcement management warned operating earnings per share were likely to be flat in the 2018 financial year. Given a still relatively lofty valuation, the weaker technical picture and already solid capital appreciation and dividends since our initial buy recommendation, we see limited scope for multiple expansion and believe it is time to take part profits.
Invocare (ASX:IVC) shares are trading on 24.8 times FY18 earnings, falling to 23.0 times the following year, while the projected yield over the same time frame expands from 3.4% to 3.6%.
Accordingly, we recommend Members sell-half their InvoCare (ASX:IVC) holding around current prices.

