
On track
National Australia Bank’s (ASX:NAB) first quarter trading update was relatively positive, albeit typically brief. The bank reported a 3% year-on-year rise in cash earnings to $1.65 billion and said it was on track to hit targets for the fiscal year. Asset quality was sound and although expenses ticked up due to investment in technology and higher salaries, management continues to target more than $1 billion in cost savings by the end of FY2020.
NAB has lagged its peers on several key metrics in recent years but some strides to transform the business have been made, with more to come. In our view, National Australia Bank now has a much more stable capital base from which to generate a return for its shareholders. Combined with an undemanding valuation, we view the shares as well placed to deliver gains for shareholders from current levels.
1Q18 Trading Update (three months to December 2017)
NAB’s first and third quarter trading updates are brief, with more information provided in the interim and full year reports. Nonetheless, on the information and commentary provided we were content enough that our investment thesis remains intact given the undemanding valuation. The shares ticked up 2.3% in trading following the release of the update, but of course have since been swept up in the broader market correction.
NAB (ASX:NAB) eked out a modest year-on-year increase in cash earnings despite some pressure from expense growth, reported good asset quality metrics and an adequate capital position, with this latter condition essential given the regulatory fluidity Australian banks are facing.
NAB chief executive Andrew Thorburn’s written commentary in the update was relatively upbeat. Regarding the outlook he stated, “Against a favourable economic backdrop including improving business confidence and continued strength in business conditions, we are optimistic about growing our bank by serving our customers better.”
NAB’s Priority Segments Net Promoter Score (NPS) improved further in the quarter, ranked highest among the major banks and by a wider margin than in the September 2017 quarter. The Net Promoter Score measures how likely customers are to recommend the bank’s services.
Revenue ticked up 1% quarter-on-quarter, with “good growth in Business & Private Banking and Corporate & Institutional Banking revenue.”
Expenses rose 4% from the prior quarter though as NAB increased investment spending and had higher personnel costs. The bank expects FY18 expenses to grow between 5-% in FY18 and then be broadly flat over the FY19-FY20 period.
Last November NAB announced it would cut its workforce by a net 4,000 jobs, or about 12% of its workforce over the next few years in an automation and streamlining of its business using new technologies. The CEO said at the time, “As we simplify, we automate processes and things move to digital channels we will need less people and as that happens we estimate there will be 6,000 less people needed in three years’ time.” The bank will be adding 2,000 people with different capabilities and skillsets over the same time frame. The hiring will mainly be in areas such as data science, technology and AI (artificial intelligence).
The goal is to realise some $1 billion in annual savings by the end of FY20. In the trading update NAB reaffirmed that target along with the $1.5 billion increase in investment spending over the next few years.
Due to the only 1% revenue increase from the prior quarter, but 4% increase in expenses, cash earnings of $1.65 billion represented a 3% decline, but were up 3% year-on-year.
NAB said the net interest margin (NIM) had declined, without providing a firm number, but did say that excluding Markets & Treasury, the NIM was broadly stable, notwithstanding the full impact of the Bank Levey and competitive pressures in home lending.
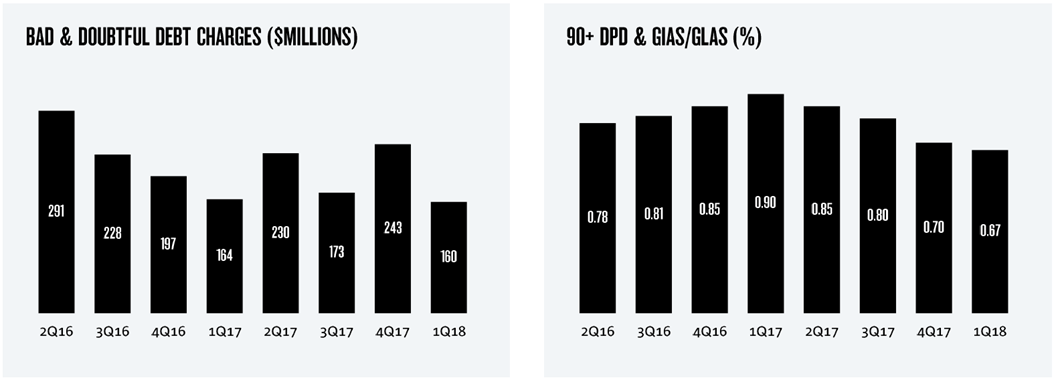
The bank’s bottom line got a helping hand from lower charges for bad and doubtful debts, which dropped 23% from the September quarter to $160 million in the December quarter.
Some of the key factors included the non-repeat of collective provision (CP) overlays in 2H17 and lower specific charges, partially offset by CP increases for planned mortgage model changes.
Source: NAB (ASX:NAB)
In addition, the proportion of customers that were more than 90 days behind on loan repayments dropped 3 basis points quarter-on-quarter to 0.67%. This was mainly due to an improvement in conditions for New Zealand dairy customers.
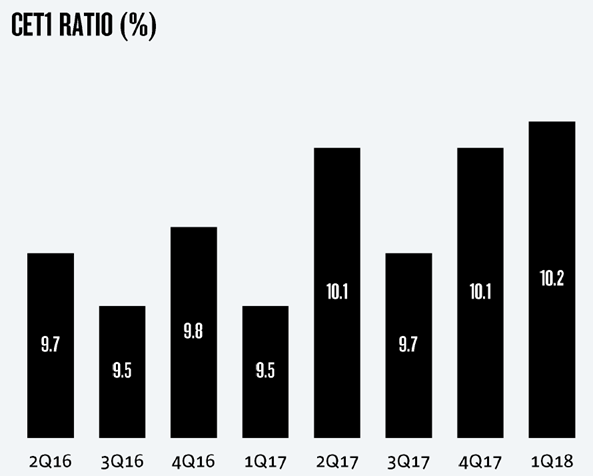
The key common equity tier 1 (CET1) ratio increased approximately 10 basis points from the September quarter to 10.2%.
Source: NAB (ASX:NAB)
Last July, APRA announced a CET1 ratio target of 10.5% by January for major banks to be viewed as “unquestionably strong.” NAB said it expects to meet this target in an “orderly manner.”
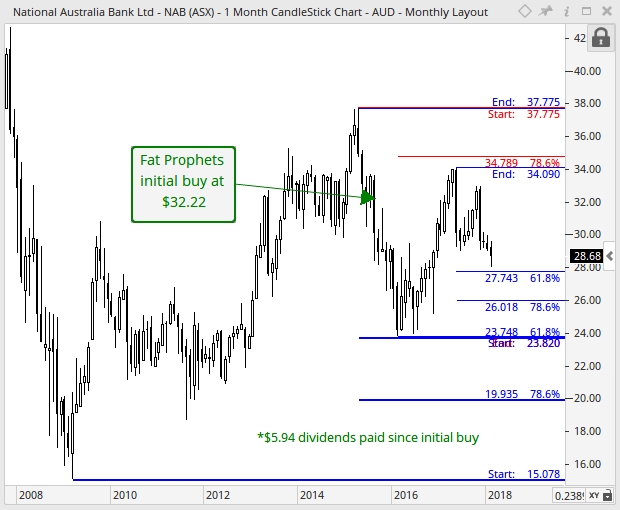
Turning to the technical picture and regarding the monthly chart, initial downside support is expected at the 61.8% Fibonacci retracement of $27.74, followed by the 78.6% Fibonacci retracement of $26.02 as represented by the thin-blue set of retracements, should the bears remain in control over the near term. It is important that the bulls defend this level, and a consolidation unfolds over the medium-term. Should this occur, then this would encourage a period of price-stabilisation to evolve, and thus ease the recent weakness in share price. If this favourable scenario was to evolve, then from a probability standpoint, a gradual ascent towards resistance evident between $34.09 and $34.79 is deemed viable. This is made up of the May 2017 high and the 78.6% Fibonacci retracement (red set of retracements) respectively. Overall, the series of higher lows and higher highs are characteristics of a dominant long-term uptrend in place, and thus would likely steer the prevailing direction of National Australia Bank.
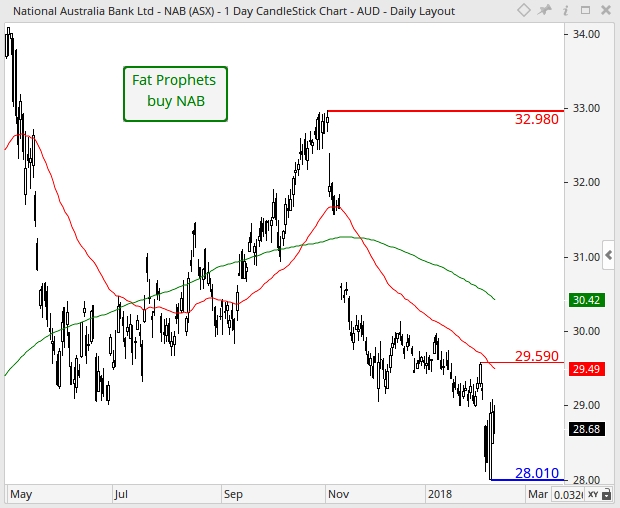
Turning to the daily chart, the bearish moving average crossover present since November 2017 is suggestive of momentum to favour the downside. This is when the 50-day moving average (red line) crosses below the 200-day moving average (green line). Should the bears remain in control over the near term, then support is expected at the February intra-month low of $28.01 as shown by the horizontal blue line. For the short-term technical outlook to improve, a decisive break above the 200-day moving average (green line) of $30.42 is required. Should this positive development evolve, then medium-term momentum would shift back in favour of the bull-camp.
Summary
With the demerger of Clydesdale Bank now in the books we believe that National Australia Bank (ASX:NAB) now has the platform and business model to generate an ROE (and consequently a price to book value multiple) closer to that of its two key peers– Commonwealth Bank of Australia and Westpac.
From a balance sheet perspective NAB management are confident they will meet APRAs 10.5% CET1 ratio requirement by January 2020.
Looking at the valuation, NAB shares trade on just 12.8 times the average FY18 earnings estimate and 11.7 times FY19, with a projected yield of approximately 6.8%.
The FY18 price to book value multiple is also modest at 1.53 times, which is a discount to peers.
If NAB can continue to lift its cash return on equity, we believe the bank’s shares can outperform the sector, which also should enjoy an upward re-rating as margins expand in a higher interest rate environment.
NAB (ASX:NAB) will remain firmly held in the Fat Prophets Portfolio. For Members without exposure and a medium-term time frame, we recommend the stock as a buy.
Disclosure: NAB (ASX:NAB) is held in the Fat Prophets Concentrated Australian Share and Australian Share Income models.

