
A Foundation to Build On
Investors responded warmly to building product supplier James Hardie’s (ASX:JHX) fiscal third quarter numbers, with the Australian-listed shares rising 6.8% in trading following the announcement. Management provided an optimistic outlook for 2018 and a strong economy and wage growth in the key United States market offers a firm foundation on which to build.
3Q18 and 9M18 headline numbers
(in US$ unless otherwise stated)
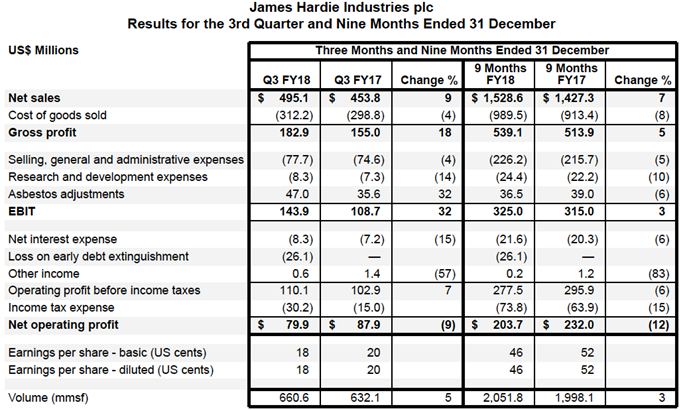
For the quarter and nine months ended 31 December 2017 James Hardie posted sales of $495.1 and $1,528.6 million, marking year-on-year growth of 9% and 7% respectively. For both periods sales benefited from a higher average net prices in North America and higher sales volumes in the international business.
James Hardie (ASX:JHX) has faced some headwinds, including sluggish volumes in the US business, as it ran up against capacity constraints and cost input pressures. Being unable to keep up with demand is a relatively ‘nice’ problem to have and management has been working to address the issue and said in the quarterly release that, “We are on track to increase manufacturing capacity, improve the performance of our North America manufacturing network and drive improved primary demand growth.”
Gross profit of $182.9 million for the quarter and $539.1 million for 9M18 increased 18% and 5% year-on-year respectively. The gross margin of 36.9% in 3Q18 increased 2.7 percentage points from 3Q17, while the gross margin of 35.3% for 9M18 decreased 0.7 percentage points from the comparable period of fiscal 2017.
James Hardie’s cost of goods sold of $312.2 million in 3Q18 marked a 4% year-on-year increase. For the first nine months of the fiscal year, the cost of goods sold was up roughly 8% to $989.5 million.
Selling, general and administrative (SG&A) expenses for 3Q18 and 9M18 year increased 4% and 5% respectively to $77.7 and $226.2 million, driven primarily by stock compensation and discretionary spending costs. The company also increased R&D (research and development) spending.
EBIT (earnings before interest and taxes) of $143.9 million in 3Q18 was up 32% from 3Q17, supported by the higher gross profit and favourable asbestos adjustment. EBIT for the 9M18 period increased by a more modest 3% to $325.0, as the asbestos adjustment in two comparable periods was similar. Group adjusted EBIT came in at $97.4 million for the quarter and $289.8 million for 9M18, marking increases of 33% and 5% respectively.
The second quarter fared better, due to higher gross profit and a lower negative asbestos adjustment than in 2Q17. This led to 2Q18 EBIT of US$97.1 million representing an increase of 10% year-on-year. Asbestos adjustments primarily reflect the reduction in the asbestos liability and the non-cash foreign exchange re-measurement impact.
Source: James Hardie (ASX:JHX)
There was little difference in the net income expense, or other income (expense) lines between the periods being compared. James Hardie did incur a loss on the early retirement of some debt, as it redeemed senior notes due 2023. The loss of $26.1 million dented net operating profit as did higher income tax expense. Net operating profit of $79.9 million for 3Q18 was down 9% year-on-year. The 9M19 net operating profit of $203.7 million marked a 12% decrease from the comparable period of fiscal 2017.
Positively, adjusted net operating profit of $69.9 million for the quarter was up 33% year-on-year, while 9M18 adjusted net operating profit increased 6%.
Diluted earnings per share came in at 18 cents in 3Q18 and 46 cents for the first nine months of the fiscal year, compared to 20 cents and 52 cents respectively. Adjusted diluted earnings per share of 16 cents in 3Q18 compared positively to 12 cents a year earlier. 9M18 adjusted earnings per share were also higher, coming in at 47 cents versus 44 cents for the 9M17 period.

Source: James Hardie (ASX:JHX)
Looking at segment performance in the third quarter and the key North America segment posted net sales of $376.8 million, up 7% year-on-year with volumes and prices both higher.
Volumes ticked up 2%, improving from a small decrease seen in the second quarter when the company lost some market share. Pricing was strong, rising 5% year-on-year. The segment’s EBIT margin impressed, expanding 5.4 percentage points to 26.9%.
The International segment posted sales of $114.5 million in 3Q18, marking a strong 15% increase from 3Q17. It was a volumes story in the International segment,
with these rising 14% year-on-year, while the average price slipped 2%. The EBIT margin was effectively flat, increasing just 20 basis points year-on-year to 22.2%.
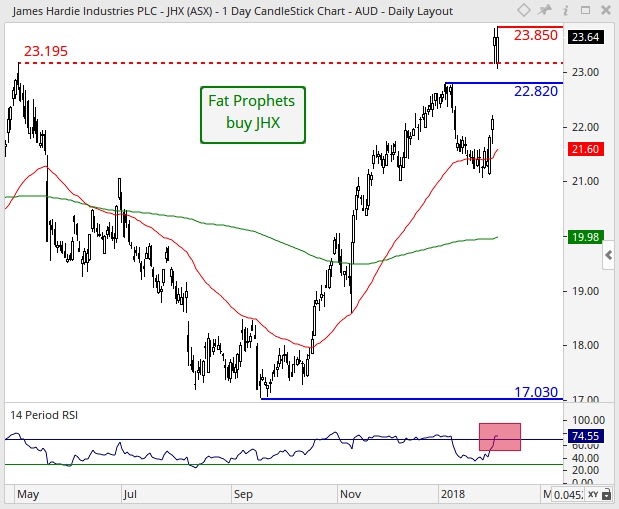
Turning to the daily chart, overhead resistance is indicated at the February intra-month high of $23.85 as shown by the horizontal solid-red line. However, it should be noted that the rapid increase in share price has resulted in the RSI to venture into overbought territory (exhaustion of short-term upward momentum). Hence, should the bears emerge over the near-term, a temporary pullback in price could follow. Positively, should this occur, we would view this short-term pause as corrective. Medium-term momentum is in favour of the bulls, as the share price has comfortably cleared both the 50 (red line) and 200 (green line) day moving averages.

Regarding the monthly chart, dynamic support sighted at the $17.00 region (long-term uptrend line) has managed to do its part in stabilising the correction evident between May and September 2017. This is deemed positive price-action, which has led to a resumption of the broader uptrend. Furthermore, and from a macro perspective, prices have closed (on a monthly-basis) above the 78.6% Fibonacci retracement of $21.88 in December 2017. This is a bullish development and now activates two additional upside targets. The initial target is expected at the 127.2% Fibonacci extension of $24.87, followed by the 161.8% Fibonacci extension of $27.01. Furthermore, long-term momentum is favoured to the upside, as evident from the series of higher lows and higher highs, which are characteristics of a dominant uptrend in play.
Summary
Australian-listed shares of James Hardie (ASX:JHX) moved to new highs after releasing a solid third quarter report. The margins at the key North America business recovered and management is addressing capacity constraints. They also were optimistic on the outlook, saying:
“We expect to see steady growth in the US housing market in fiscal year 2018. The single family new construction market and repair and remodel market are expected to grow similarly to the year-on-year growth experienced in fiscal year 2017. The Company expects new construction starts between approximately 1.2 and 1.3 million.”
With three fiscal quarters already in the bag, management now expects full year adjusted net operating profit to be in the range of $260 million to $275 million. At the midpoint that would represent growth of approximately 7.6%.
The European acquisition announced last year should diversify the business and provide a growth platform in Europe, where previously James Hardie has had comparatively little traction.
We remain positive on James Hardie’s ability to grow earnings at a robust pace. Rising interest rates are likely to be only a modest headwind considering they will still be at low levels and meanwhile, the US economy is ticking over nicely and wage growth is beginning to flow through more meaningfully. US housing stock also will need to be replenished with a period of ‘underbuilding’ in the wake of the GFC.
We believe the US housing and repair and remodelling market will continue to be healthy for some time. Therefore, we view James Hardie as well placed to capture some of the remaining opportunity, with capacity constraints being addressed.
The shares trade on approximately 29.8 times forecast FY18 earnings, set to drop to 24.3 times the following year.
James Hardie (ASX:JHX) will remain held in the Fat Prophets portfolio. For Members without exposure, and taking a long-term view, we remain comfortable continuing to recommend the stock as a buy around current levels.
Disclosure: James Hardie (ASX:JHX) is held in the Fat Prophets Concentrated Australian Share and Australian Small & Mid Cap Models.

