
Banking on Queensland
Bank of Queensland (ASX:BOQ) raised $350 million from its Capital Notes hybrid offering in December 2017, after increasing the raising from an initial $325 million size due to “strong” investor demand. The bank’s robust capital position provides a significant degree of optionality, with management discussing at the company’s Annual General Meeting, potentially using some of excess capital to accelerate investment in the business. If appropriate opportunities to deploy excess capital aren’t found, we expect more capital to be returned to shareholders down the track.
As at 30 November 2017, according to its Basel III Pillar 3 Disclosures, BOQ’s Common Equity Tier 1 (CET1) ratio was 9.0%, compared to 9.4% at 31 August 2017. The total capital ratio was at 12.0% (12.4% at 31 August 2017). We are waiting on the interim results from BOQ in April for more detail, but there have been no red flags and management are relatively optimistic on the outlook given Queensland economic forecasts are positive on the back of still low interest rates, strong tourism growth, resources, housing and public expenditure.
At the AGM, management did express wariness due to high household indebtedness, high and rising cost of living, a relatively soft employment market and potentially higher interest rates among other factors. However, with asset quality at BOQ sound, it is well placed to weather any stress.
The business bank had a strong second half last year and management said at the AGM that momentum had continued into the new financial year, with “a strong pipeline and settlements.”
To recap FY17 key numbers, BOQ’s statutory net profit after tax (NPAT) of $352 million marked a 4% increase from the prior year. The more closely watched cash earnings after tax was up 5% from FY16 to $378 million, which surpassed the consensus estimate of $360 million. The result did include a $16 million profit in the disposal of a vendor finance entity and excluding that one-off item cash earnings increased 1% to $362 million. Basic cash earnings per share came in at 97.6 cents, up 2% from 95.6 cents in FY16.
The bank maintained its full year ordinary dividends at 76 cents but gave shareholders a small treat with a special dividend of 8 cents per share to take the total dividends to 84 cents. Return on equity ticked up 10 basis points from FY16 to 10.4% in FY17.
There was an improvement in momentum in the second half of the year, with cash earnings of $203 million compared to $175 million in 1H17. Excluding the one-off benefit from the vendor entity sale, 2H17 cash earnings were $187 million.

Source: BOQ (ASX:BOQ)
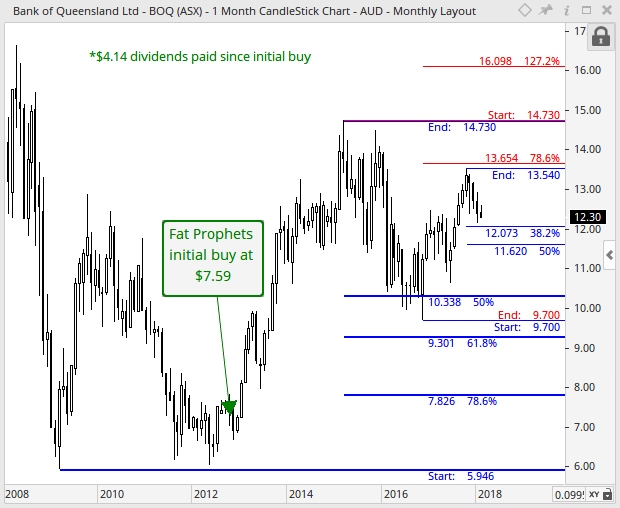
Turning to the charts, and regarding the monthly, prices have respected support at the long-term 50% Fibonacci retracement region (solid-blue set of retracements) of $10.34 in November 2016 to stage a healthy recovery in the share price. This led to a healthy upward trajectory in share price to reach a high of $13.54 in October 2017. At present, a short-term correction is underway, and should it continue, support is expected between $11.62 and $12.07. This is made up of the 50% and 38.2% Fibonacci retracement levels as represented by the thin-blue set of retracements. Looking ahead, and for the broader technical outlook to strengthen, prices need to close (on a monthly-basis) above the 78.6% Fibonacci retracement of $13.65 (red set of retracements). If this favourable scenario was to unfold, then an activation of the next upside target towards the 127.2% Fibonacci extension of $16.10 would then be triggered.
On the daily chart, initial support is expected at the 50% Fibonacci retracement of $12.09, followed by the 61.8% Fibonacci retracement of $11.75, if the bears were to maintain downward pressure over the near term. For the short-term technical outlook to improve, a sustained break above the 50-day moving average (red line) of $12.58 is required. Should this occur, then momentum would once again shift in favour of the bull-camp, which would likely translate to a resumption of the medium-term uptrend.

Summary
Given a challenging environment, Bank of Queensland delivered a solid result for FY17, with cash earnings up 5% year-on-year. The bank also declared a special dividend of 8 cents per share.
Although Management noted some ‘challenges’ in the trading environment last fiscal year, including low home loan growth, the overall result ticked a lot of boxes in our view. Improving credit quality was a feature, with bad debts falling 28%. There was also some evidence of margin expansion in the second half of the year along with a return to lending growth.
We are positive on the prospects for the Queensland economy, and particularly the Gold Coast, given its appeal to migrants, tourism on the up and the Commonwealth games just around the corner.
In the Roy Morgan banking customer satisfaction survey released late January, of the 10 largest consumer banks, Bank of Queensland (ASX:BOQ) scored 86.0% (+0.8%) second highest after Bendigo Bank.
Management are wary of the risks in the Brisbane apartment market, but with the capital position strong BOQ is well placed to withstand a moderate shock. Geographically, approximately 46% of the housing loan book is in Queensland. It also stands to benefit from the interest rate cycle turning up and the inclination of the big banks to pass the government levy onto customers.
We remain encouraged by BOQ’s ability to deliver growth through other niche business channels as well, including the Specialist medical business, Virgin Money and Business Banking.
Accordingly, and with BOQ trading on a modest earnings multiple of 12.7 times, and offering a yield of around 6.5%, we continue to rate the shares as a Buy for Members without exposure.
Disclosure: Bank of Queensland (ASX:BOQ) is held within the Fat Prophets Concentrated Australian Share, Australian Share Income and Small & Mid cap models.

