
Not the usual fanfare
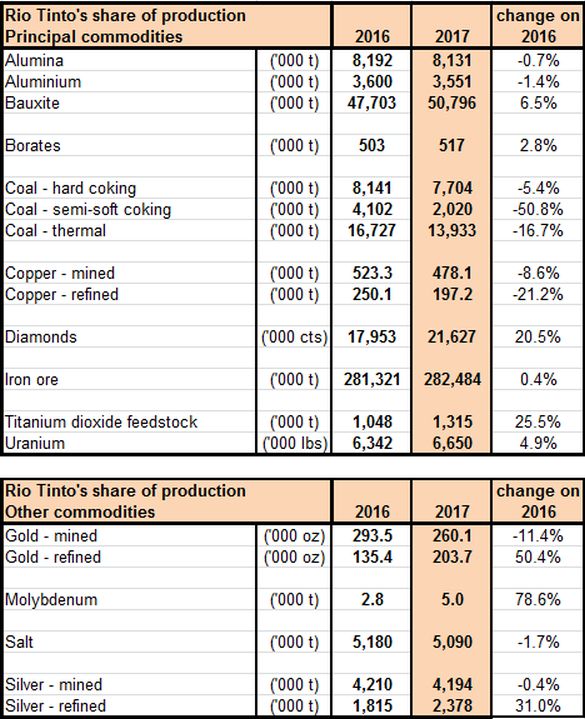
Rio Tinto (ASX:RIO) has announced its operational results for the full year to 31 December 2017, and in doing so has revealed an ordinary set of results. The company generally hit 2017 guidance, with its key iron ore operation only just getting to the line for the year. The usual production records were a little confined with the iron ore (again) and bauxite operations the standouts for the year. The following table shows the company’s 2017 operational results:
Source: Rio Tinto (ASX:RIO)
Of the company’s key operations, its overall coal operations were a little disappointing, as were the perennial underperformer in aluminium and less so alumina. The copper operations added to the underwhelming result for the year while diamonds offered a little sparkle for the year. Although, the 2017 operational result in our view was ordinary, we believe the full year financial result will be very positive due to higher realised commodity prices and continued cost savings.
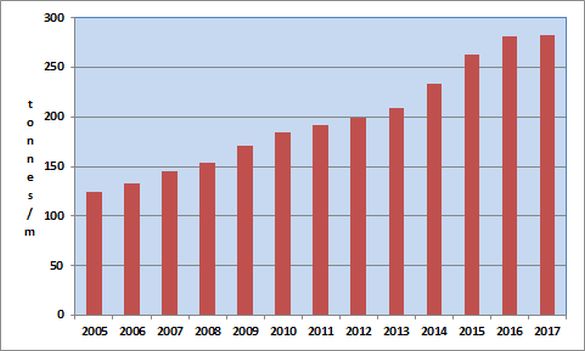
Iron ore turned in another record performance in 2017, with shipments just edging over the line of the 330 million tonnes (100% basis) guidance for the year, to hit 330.1 million tonnes (100% basis). Being the company’s key operation, we view the result as satisfactory. Iron ore production attributed to the company reached a record 282.5 million tonnes, representing a slight 0.4% rise on 2016. The following chart shows annual attributable iron ore production:
Source: Rio Tinto (ASX:RIO)
As Members can see from the above chart, the long trend of record production remained intact, with the company’s operations in the Pilbara again driving a successful year.
The company reported good production gains across its Hamersley mines, with production increasing by 6.2% on 2016, to a record 236.7 million tonnes. The improved performance reflected productivity gains across all the company’s Pilbara sites including Hope Downs which shut down for a planned two weeks.
The Pilbara mines continue to be the driving force behind the operational results for the segment. Iron Company of Canada (ICOC, Rio’s interest 59%) however chipped in with a cameo, lifting production by 4.7% on 2016, to hit 11.2 million tonnes of pellets. Operational efficiency was the primary driver of the better ICOC result.
Guidance for iron ore shipments in 2018 is forecast to be in the range 330 million to 340 million tonnes (100% basis).
The variable production profile in refined copper continues, but with an unfortunate negative slant for 2017. Production trends have been problematic for the company
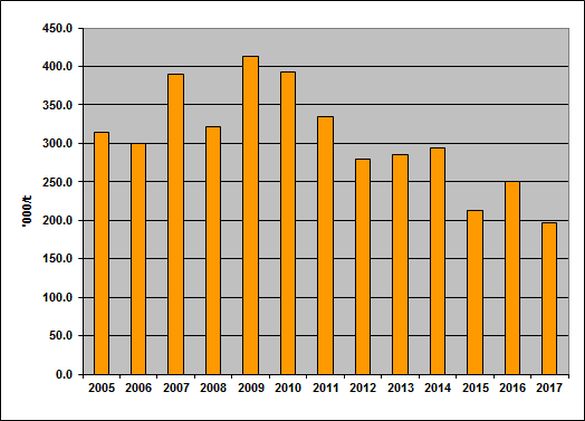
following numerous issues across its copper assets; issues the company has been addressing, with its efforts not reflected in the 2017 result. For 2017, refined copper production trended lower but was within guidance for the year in the range of 185,000 tonnes to 225,000 tonnes. Refined copper production fell by a significant 21.2% on 2016, to 197,200 tonnes. The following chart shows annual copper production.
Source: Rio Tinto (ASX:RIO)
The Kennecott Utah mine drove the lower 2017 performance, as a result of operational issues requiring a shutdown. Refined copper production at the Kennecott Utah complex declined by a significant 20% on 2016, to 125.8 million tonnes.
The company’s other copper operation in Escondida (Rio’s interest 30%) also reported a significant fall in refined copper production of 24% on 2016, to 71,400 tonnes. Labour issues played a major role in the sites’ poor performance for the year.
Total mined copper for 2017 fell by a modest 8.7% compared to 2016, to 478,100 tonnes. Three of the company’s sites in Bingham Canyon (Kennecott Utah), Escondida and Oyu Tolgoi (Rio’s interest 34%) reported lower production for the year. The company’s largest producer of mined copper in Escondida reported a 10.7% fall on 2016, to 270,800 tonnes. As already cited, labour issues drove the result.
The Oyu Tolgoi mine turned in a 22% fall in mined copper for the year when compared to 2016, at 52,800 tonnes of mined copper.
The mining of lower grade ore as scheduled drove the result. The
Bingham Canyon site also reported a modest fall of 2.5% on 2016, to 148,900 tonnes. As already cited, operational issues drove the result for the year.
Guidance for 2018 for mined copper is expected to be in the range of 510,000 to 610,000 tonnes and for refined copper some 225,000 to 265,000 tonnes.
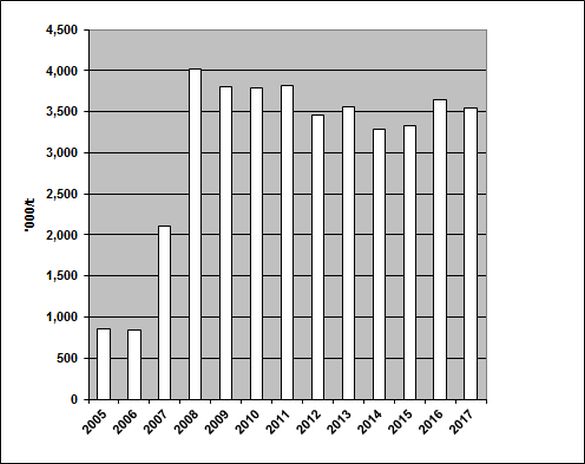
Aluminium has been a perennial problem area for the company since it acquired Alcan in 2007 for some US$38 billion. The company has persisted, however operations continue to underperform. The following chart shows aluminium production:
Source: Rio Tinto (ASX:RIO)
Aluminium production printed a 1.4% fall compared to 2016, to 3.6 million tonnes, and was in line with 2017 guidance. Operations at the company’s Queensland smelter in Boyne Island (Rio’s interest 59%) on higher electricity charges reported a 13% fall on 2016, to 302,000 tonnes. Efforts by the company to invigorate its aluminium operations have taken time and faced market headwinds, and we thought an inflection point was made in 2015; this may now not be the case, as gaining traction in the segment remains elusive.
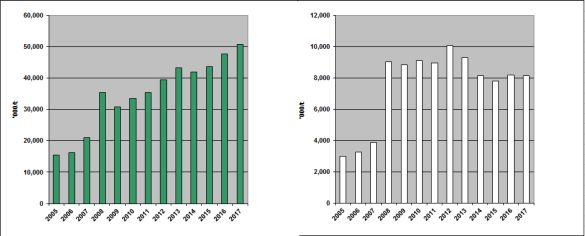
The company’s upstream bauxite and midstream alumina operations reported divergent performances for 2017. The following charts show annual production for bauxite (left) and alumina (right):
Source: Rio Tinto (ASX:RIO)
Bauxite production rose by 6.5% compared to 2016, to a record 50.8 million tonnes, and was in line with 2017 guidance range of 50 million tonnes to 51 million tonnes.
Behind the better bauxite performance was the key Gove mine. Compared to 2016, Gove increased production by 21.3%, to 11.2 million tonnes on production efficiency gains.
Alumina production was lower for the year by 0.7% compared to 2016, at 8.1 million tonnes and was within guidance range of 8.0 million to 8.2 million tonnes.
The company’s smelters reported mixed results with operations performing as expected for the year. Operational improvements on robust third party demand drove the result at the company’s biggest contributor in the Canadian six where production rose to 1.6 million tonnes from 1.5 million tonnes from a year earlier.
Guidance across the aluminium operations for 2018 will see aluminium production rise to the range of 3.5 million to 3.7 million tonnes.
This forecast will be adjusted as the company has sold the Dunkerque smelter. Alumina is forecast to fall in the range of 8.0 million to 8.2 million tonnes in 2018, while bauxite is forecast to be in the range of 49 million to 51 million tonnes.
Thermal coal production reported a 17% fall on 2016, to 13.9 million tonnes. Guidance for 2017 was in the range of 13 million to 14 million tonnes. The following chart shows thermal coal production:

Source: Rio Tinto (ASX:RIO)
The sale of Coal & Allied in the December quarter is behind the lower result with some 3.0 million tonnes lost to the sale. Hard coking coal reported a 5.4% fall on 2017, to 7.7 million tonnes. Weather related events were the biggest driver of the result.
Guidance for the different coal types for 2018 has been forecast to be in the range of 3.8 million to 4.5 million tonnes for thermal and 7.5 million to 8.5 million tonnes for hard coking.
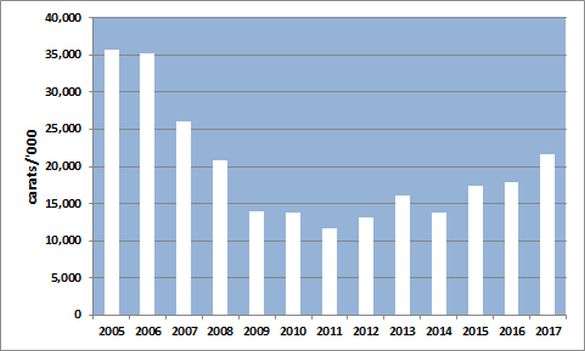
Diamonds turned in a good result for 2017, with the printing of a 20.5% rise on 2016, to 21.6 million carats, to come in at the top-end of guidance. Guidance for 2017 was forecast to be in the range of 19 million to 22 million carats. The following chart shows diamond production:
Source: Rio Tinto (ASX:RIO)
Both the Argyle mine and the Diavik mine reported better production, with Argyle the largest contributor and standout. The Argyle mine reported a rise of 23% on 2016, to 17.1 million carats, on the back of scheduling higher grade ore and improved recoveries. The Diavik mine lifted production 497,000 carats in 2017 to hit 4.5 million carats.
Guidance for 2018 diamond production is forecast to be in the range of 17 million to 20 million carats.
Uranium production for 2017 printed a 4.9% rise on 2016, to 6.7 million pounds, which was within guidance for the year of 6.5 million to 7.5 million pounds. The following chart shows uranium production:

Source: Rio Tinto (ASX:RIO)
Driving the better result was the company’s Rossing mine (Rio’s interest 68.6%) on improved infrastructure utilisation and efficiencies lifting production by 14% on 2016, to 3.2 million pounds. The wind-down of operations at Energy Resource Australia’s (ERA, Rio’s interest 68.4%) Ranger mine with the processing of tailings resulted in a 2.4% decline in production compared to 2016, to 3.5 million pounds.
Production guidance for uranium in 2017 is forecast to be in the range of 6.2 million to 7.2 million pounds.
Overall, the operational numbers for 2017 were a little short of our positive view of Rio Tinto (ASX:RIO). Its key iron ore group continues to be the mainstay of performance, but 2017 delivered a split between negative outcomes and positive outcomes across its operations. We believe the 2017 operational result will have a net negative on the company’s full year financials for 2017, with the iron ore segment set be a positive partial offset. The company will report its full year financial result on 7 February 2018.
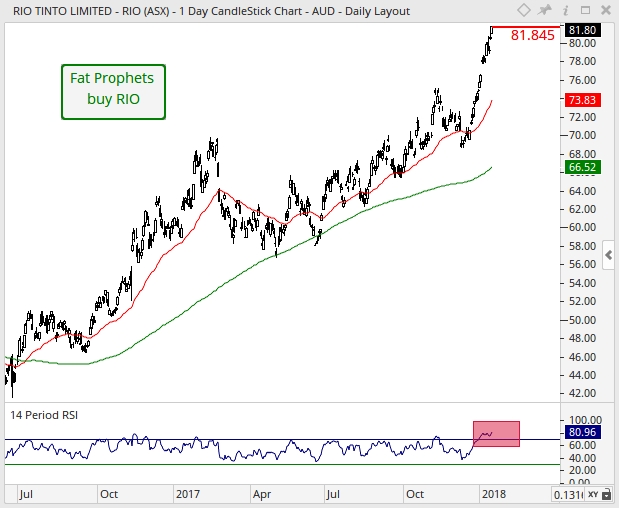
Turning to the daily chart, overhead resistance is situated at the January intra-month high of $81.85 as shown by the horizontal solid-red line. However, it should be noted that the rapid increase in share price has resulted in the RSI venturing deeply into overbought territory (exhaustion of short-term upward momentum). Hence, should the bears emerge over the near-term, then a temporary and healthy pullback in price could potentially be on the cards. Positively, should this occur, we would view this short-term pause as corrective. From a medium-term momentum perspective, this remains in favour of the bull-camp as backed by the bullish moving average crossover present since July 2016. This is when the 50-day moving average (red line) crosses above the 200-day moving average (green line), and thus would likely steer the prevailing direction of Rio Tinto.
Looking at the company’s 2017 full year result, we expect revenue and both the underlying and reported profits will be higher, reflecting the rise in commodity prices over 2017, while the operational performance will detract. As cited, we expect volumes will have a negative impact on the financials, albeit a minor one), while the company’s ongoing cost saving programmes will also be positive. As a result, we expect the company will report a higher underlying profit than the US$5.1 billion reported for 2016. We expect underlying profit for 2017 will be in the range of US$5.5 billion to US$6.0 billion.
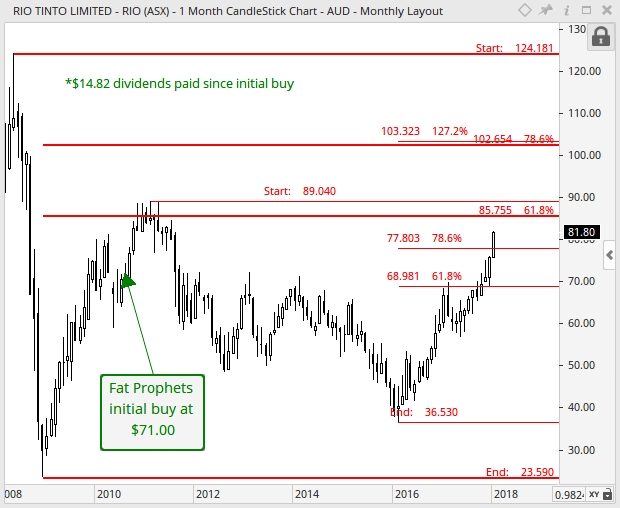
With reference to the monthly chart, resistance was respected at the 61.8% Fibonacci retracement (thin-red set of retracements) of $68.98 in February 2017. This led to a short-term correction to unfold until May 2017, which has now terminated. Moving forward, we would expect prices to gravitate towards a band of resistance evident between $85.76 and $89.04. This is made up of the long-term 61.8% Fibonacci retracement (solid-red set of retracements) and the February 2011 resistance level respectively. A definitive clearance of this price range would likely boost upward momentum and result in a gradual ascent towards the next resistance range sighted between $102.65 and $103.32. This consist of the long-term 78.6% Fibonacci retracement (solid-red set of retracements) and the 127.2% Fibonacci extension respectively.
Rio Tinto (ASX:RIO) has a robust balance sheet and has maintained a strong cash flow that places it in an enviable position to develop its pipeline of projects. With this financial capacity the company is able to advance shareholder value across commodity cycles and over time.
Consequently, we continue to recommend Rio Tinto as a buy for Members with no exposure to the stock.
Disclosure: Rio Tinto (ASX:RIO) is held within the Fat Prophets Concentrated UK Share, Fat Prophets Mining and Resources and Fat Prophets Concentrated Australian Share portfolios.

