
FY22; prices nip and costs bite
Fortescue has released its 2022 financial results to show a satisfactory performance for the year, as weaker prices and cost pressures tugged on the numbers. Operations delivered record ore shipments, and toward the top end of guidance for 2022. The balance sheet remains sound but did take on more gearing. While shareholders did see a fall in the full year dividend. The following table summarises Fortescue’s 2022 results (m – million, wmt – wet metric tonne, dwt – dry metric tonne, EBITDA- Earnings Before Interest Taxation Depreciation Amortisation, NPAT – net profit after taxation):

Source: Fortescue
The full year result was a satisfactory one, in our view, with rising costs and a regearing of the balance sheet taking some shine off the outcome for the year. A softer dividend was also a setback when rating the year. We were pleased with the uptick in production for 2022, accompanied by record iron ore shipments. 2023 guidance for iron ore shipments remains within sight of record territory added positive weight, while costs on a rising trend forecast was a detraction.
At the underlying NPAT line, Fortescue reported a 40.1% year-on-year (yoy) fall, to US$6.2 billion for 2022. The following chart shows the major factors that impacted on Fortescue’s underlying NPAT line for 2022:
 Source: Fortescue
We use the underlying NPAT, as this metric better reflects the ongoing daily operations by excluding items considered specific to the reporting year. Members can see from the above chart, the factors that impacted on Fortescue’s result for the year.
Price is an external factor (not controllable by Fortescue), and as Members can see from the above chart, this metric was the single biggest contributor for the year, removing US$6.1 billion off Fortescue’s bottom line. In contrast, 2021 for the same metric was a massive positive of US$9.4 billion. Fortescue reported a 26.2% yoy fall in its average realised iron ore price to, US$99.80 a dry metric tonne. As a single commodity entity iron ore was the sole contributor. Although early in Fortescue’s 2023 financial year, the iron ore price to date has slipped lower relative to the same period for 2022. We have a positive outlook for iron ore prices in 2023 but can see volatility over the remainder of calendar 2022. Our 2023 view is premised on the Chinese economy stabilising, a persistently sticky inflation and a weak US Dollar on rising debt concerns. An added tailwind in the form of governments maintaining infrastructure spending will sustain iron ore demand and with this the price.
The daily price chart for FMG indicates the price is trading above the 20 day simple moving average and remains within a large consolidation pattern between $16.50 and $22.00.

Operations were a pleasing standout for Fortescue for 2022, with an overall positive contribution to its bottom line. Members can see from the above waterfall chart that volumes added US$776 million to Fortescue’s bottom line, compared to the US$200 million reported for 2021. Fortescue reported a 1.5% yoy increase in iron ore production, to, 188.6 million wmt, with shipments totalling a record 188.6 million wmt to report a rise of 4.1% yoy. Fortescue is guiding 2023 shipments to be in the range 187 million tonnes to 192 million tonnes and remains within a new record reach.
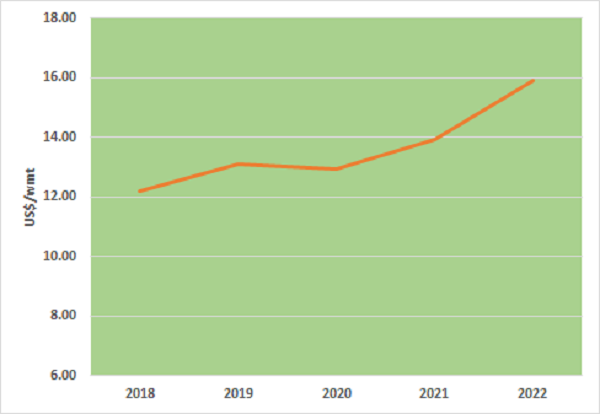
The other important metric for operations is unit costs, and on this front Fortescue reported a rise of 14.2% yoy, to US$15.91 per wmt in its C1 cash cost. The following image shows annual C1 cash costs:
Source: Fortescue
This rise brought with it a negative US$960 million to the 2022 NPAT line, which compares unfavourably with the negative US$296 million reported for 2021. As a result of the C1 movement, Fortescue saw its EBITDA margin compress to 61% from the record 73% for 2021. A partial cause of this compression was mining ang and processing costs jumping 20.3% yoy, to US$2.5 billion. Given the current inflationary environment, the C1 cost trend is to be expected it is however concerning. The old adage is that a rising tide lifts all boats is certainly a key factor on this front, higher cost producers will be under extreme pressure.
C1 costs for hematite for 2023 is forecast to be in the range of US$18.00 per wmt to US$18.75 per wmt. Given persistent inflationary pressures in 2023, we agree with Fortescue’s expectations, it does however remain a very low cost producer of iron ore, which provides a partial cushioning in a hostile cost environment.
Net operating cash flow fell 47% yoy, to US$6.6 billion. The following chart shows Fortescue’s annual net operating cash flow:

Source: Fortescue
The fall reflects a softer iron ore price and higher costs, while some relief came from lower capital spending over the year. Fortescue’s aim is to ensure free operational cash flow can support dividends, sustain operations and also drive growth.
Capital spending for 2022 totalled US$3.1 billion, which represents a yoy fall of 15.4%, to US$559 million. Sustaining capital consumed US$1.4 billion, exploration and related studies took US$194 million and major projects US$1.1 billion. Fortescue Future Industries took US$130 million of the 2022 capital pie. We are comfortable with the exploration spend, given the long life nature of Fortescue’s asset base and the brownfield potential these have. Capital expenditure for 2023 is forecast to be in the range of US$2.7 billion and US$3.1 billion.
Fortescue Future Industries is gaining momentum in the green energy space. Fortescue has committed to funding Fortescue Future Industries to the tune of 10% of its profits on an annual basis. For 2022, Fortescue Future Industries expended US$534 million, with operations taking US$386 million and capital spending US$148 million. We applaud this initiative and expect over time it’s potential value could be significant.
Fortescue Future Industries is expected to be funded to US$600 million to US$700 million in 2023. Operating expenses are forecast to be in the range of US$500 million to US$600 million and capital spending of US$100 million.
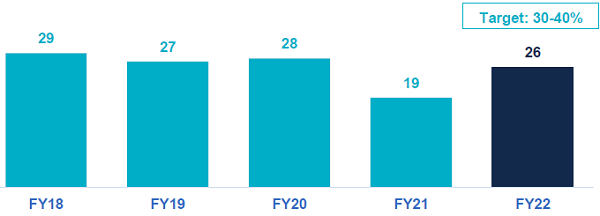
Fortescue continues to maintain a robust balance sheet with 2022 being no exception, although it did step back just a tad on this front. The balance sheet does however remain a key feature. Net debt as of 30 June 2022 stood at US$879 million compared to the net cash of US$2.7 billion from a year earlier. Gross gearing as a result came in higher for 2022. The following chart shows Fortescue’s annual gross gearing (in % terms):
Source: Fortescue
Gearing on a (net debt)/(net debt plus equity) basis, as Members can see rose to 26% as at 30 June 2022 from 19% a year earlier. The 2022 result remains below Fortescue’s targeted range of 30% to 40%. We are comfortable with the regearing and have no concerns over the current structure of Fortescue’s balance sheet. We continue to consider it a base from which Fortescue can launch development and growth forays.
The Monthly chart for FMG indicates the price is currently trading above the 12 month simple moving average and consolidating above the recent trendline

The 2022 dividend came in lower on the back of the softer financial performance for the year. Shareholders will receive a $2.07 per share fully franked dividend which was 42% down on the 2021 result. Fortescue indicated its dividend payout ratio for 2022 was 75%, coming in at the up end of the 50% to 80% of full year NPAT. We were a little disappointed there was no share buyback, as it creates long-term permanent value for shareholders.
The 2022 result was, in our view, acceptable, given the challenging pricing environment Fortescue faced for its iron ore offerings. We see iron ore prices in 2023 remaining positive. The remainder of 2022 could however be volatile. We believe Fortescue’s current share price reflects this near-term volatility, but we believe the bar is set to low for 2023 and beyond.
Consequently, our buy recommendation for Fortescue Metals (ASX:FMG) for Members with no exposure remains unchanged.
Disclosure: Interest associated with Fat Prophets holds shares in Fortescue Metals (ASX:FMG).

