
Back to Profit
Shares in the QBE Australia Group (ASX:QBE) share price has, at a glance, taken a dip right after the release of its earnings result for the fiscal 2021. Looking at the numbers, gross written premiums were a positive having delivered double digit growth up 25.7% year-on-year and marked improvements, especially the return to profit, in many areas of the business. Today, we take a close look at the results to see what has happened and find the culprit for the dip.

FY21 Results Review
Starting from the top and QBE (ASX:QBE) finished the year strong having delivered a 25.7% year-on-year increase (or 21% in constant currency) in Gross Written Premiums (GWP) to US$18.45 billion. According to management, the growth in GWP was driven by a combination of a (i) “strong premium rate” environment as well as (ii) acquisition of new customers and (iii) improved customer retention across all regions.
All in all, growth in the metrics is a big plus especially market share wins and keeping them. However, growth in GWP was also influenced by some global trends: inflation and increasing concerns of catastrophes. On the former issue, rising prices have been a seen following the advent of COVID-19 which has disrupted supply chains worldwide and coupled with accommodative monetary policy has resulted in fewer goods chased by more cash – not good trends. Next, the impact of climate change has resulted in major shifts in the environment with many parts of the world suffering from an increase in typhoons/hurricanes and others seeing flash floods or the exact opposite, drought.
In any case, this was a solid result for QBE and we’re pleased to see that among its divisions, Crop Insurance was especially strong up 51% due to the significant increase in corn and soybean prices coupled with targeted organic growth. Adjusting out for Crop, though, GWP increased by a still notable 18%, or taking out premium rate increases (which account for ~10%), up from 7% in 1H21 and 4% year-on-year.
On a regional basis, we noted GWP moderated slightly in International (+7% yoy) across the year, momentum accelerated in North America (+15%) and Australia Pacific (+11%) during the second half.
 Source: 18 February 2022 QBE (ASX:QBE) Presentation
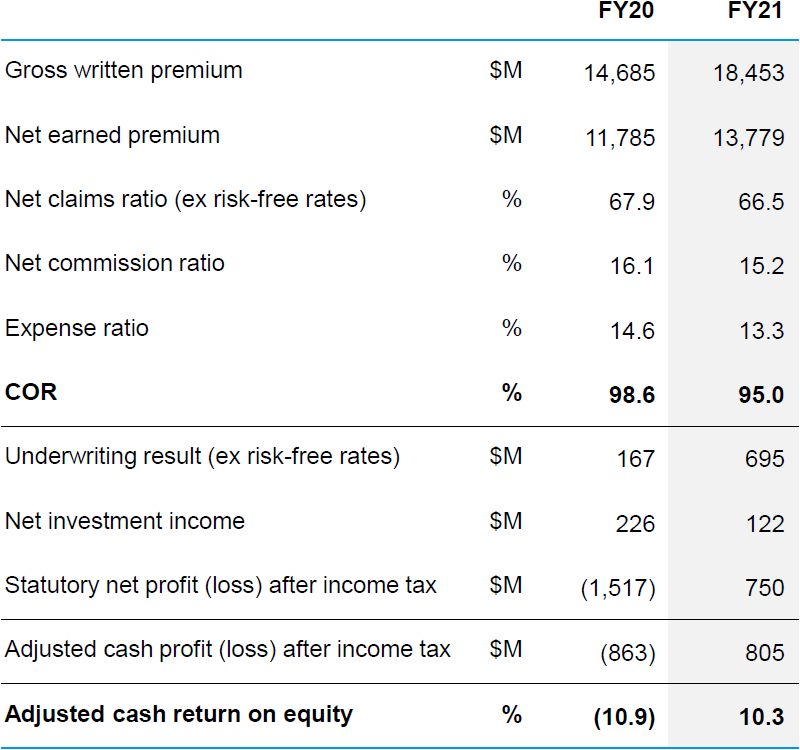
Moving on to the cost side, QBE reported a statutory combined operating ratio (COR) of 93.7% which is a notable improvement to last year’s 104.2% result. Last year saw the impact of COVID-19 which had quite a number of claims as well as adverse prior accident year claims development. Note to Members is that a lower COR number (below 100%) is profitable and the opposite (>100%) implies a loss.
Looking closely at other details, QBE (ASX:QBE) also reported improved underwriting performance with a 1.4% improvement in the ex-cat claims ratio and a 2.2% reduction in the combined commission and expense ratio which more than offset significantly increased catastrophe claims. On the latter point, catastrophe claims for the year were $905 million or 6.6% of net earned premium, up materially from $688 million or 5.8% from last year. It is also 0.9% higher than the budgeted allowance. This is due to the effect of higher claims from Winter Storm Uri, Hurricane Ida, Storm Bernd, Cyclone Seroja and widespread flooding and storm damage in Australia.
The combined commission and expense ratio improved to 28.5% from 30.7% in the prior year, reflecting further benefits stemming from management’s operational efficiency programme coupled with operating leverage associated with strong premium growth, particularly in Crop as noted earlier. Favourable business mix changes, including growth in Crop, coupled with the purchasing of additional quota share reinsurance contributed to a reduction in the commission ratio.
 Source: 18 February 2022 QBE (ASX:QBE) Presentation
Next up, the insurer also reported slightly weaker net investment income at $122 million compared with last year’s $226 million. The dip was largely non-cash and reflecting the effects of higher benchmark interest rates on the group’s bond portfolio (higher rates mean bond prices will dip). That issue, however, is mitigated by the fact that management has reallocated bond exposures towards short duration (i.e. no longer as impacted by interest rate risk) and coupled with increased exposures towards equities.
Ultimately, this led to QBE reporting a statutory net profit after tax of $750 million a major year-on-year improvement from the $1.5 billion loss last year. On an adjusted net cash basis, its profit after tax came in at $805 million which is about 7.5% below consensus expectations of $870 million – the likely culprit for the dip post-earnings release. Regardless, we find the outcome a positive one with the company navigating a difficulty environment to profit.
 Source: 18 February 2022 QBE Presentation
We also like the fact that QBE (ASX:QBE) is in a better enough financial position to actually bump up the dividends. In the release, management declared a final dividend of 19 cents per share, partially franked at 10%. That was well above the insurance company’s interim dividend of 11 cents per share (also franked at 10%) that was paid out in September last year. It brings QBE’s total dividends for FY21 to 30 cents per share – showing that QBE is starting to recover with its dividend payouts and should be a bit of pleasant news for income investors.
QBE (ASX:QBE) shares will trade ex-dividend for this final payout on 7 March. Investors will get the paycheque on 12 April.
Outlook
Going forward, management has noted a cautiously optimistic on the future with CEO Andrew Horton saying that “Following another year of elevated natural catastrophe claims costs alongside rising inflationary signals and continued low interest rates, the industry operating environment remains highly uncertain. Because of this, the premium pricing environment is likely to remain positive in 2022.”
“In light of this, we expect gross written premium growth to be in the high single digits in 2022. Moreover, delivery against our strategic priorities should result in an improved and more consistent return profile over time such that the Group is capable of consistently delivering a low to mid-90’s combined operating ratio. “In FY22, we expect the business will achieve further steady improvement on the FY21 ‘exit’ combined operating ratio of ~94%.”
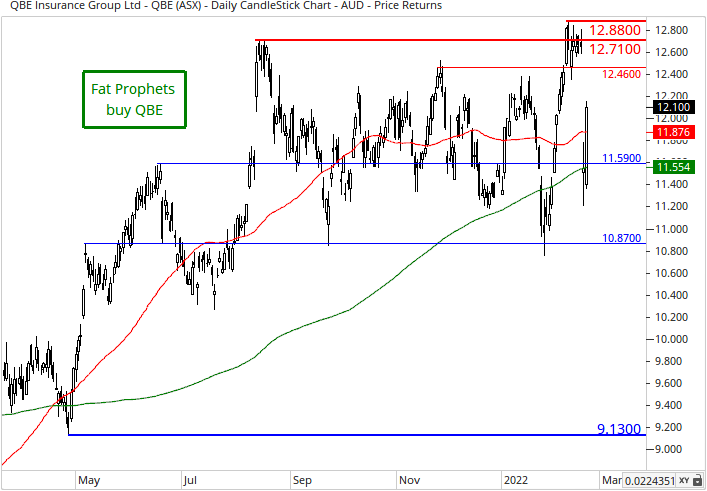
We continue to recommend QBE Insurance (ASX:QBE) as a buy to Members without exposure and a medium to long term investment horizon.
Disclosure: Interests associated with Fat Prophets hold shares in QBE Insurance (ASX:QBE).

