
Struggling to follow inflation
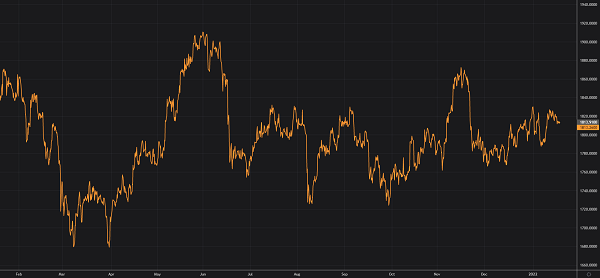
The gold price has struggled to maintain any price traction over the past 12 months, as US inflation hits highs not seen since the early 1980’s. The two key metrics in inflation and a weak US Dollar, will in our view be persistently present in 2022 and will be the dominate forces pushing the gold price higher. Our conviction around gold transitioning through a nadir in 2021 has not changed. The following chart shows the 12 months gold price (in US dollars per ounce):
Source: Reuters
As Members can see from the above chart, over the past 12 months gold has fallen, losing 1.6% to close at US$1,812.58 an ounce. The long held tradition that gold rises during inflationary periods has been questioned in recent months.
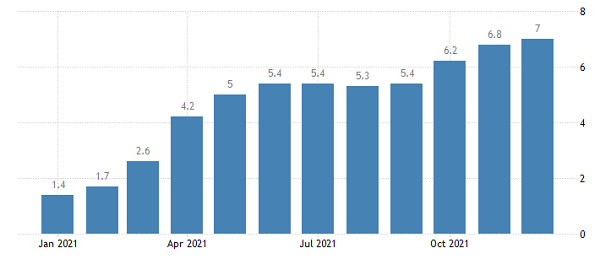
Inflation is on the march, with the latest US data read on inflation showing annual US core inflation to December 2021 coming in at 7.0% and ahead of consensus for a rise of 6.8%. The following chart shows annual US core inflation (percentage):
Source: TradingEconomics
Members can see from the above chart, inflation for April 2021 through to December 2021 has climbed and steeply. Although the US economy is recovering from its 2020 pandemic lows, due to the quantum of spending that has been thrown at it, the recovery is now dealing with labour shortage, logistics disruptions and input cost pressure and the outcome has been quite predictable.
We see inflation continuing to accelerate going into 2020. The US M2 remains at elevated levels, as US spending programmes and the economic recovery sustain the velocity of dollars circulating in the economy. The following chart shows US M2 money growth and annual inflation (M2 growth – black line and annual inflation rate – red line):

Source: Longtermtrends
We have presented this graph on many occasions; the difference is the pickup in the red inflation line. The US M2 continues to grow at around 10%, so if history holds then inflation in the US has further to rise, and that is precisely what is happening. As Members can see from the above chart, M2 is growing at a velocity not seen since the early 1940’s and one can see what happened in the mid 1940’s to inflation. We are not suggesting inflation will get that high, but the potential is there. Should the Fed delay in commencing is full tightening cycle the genie may escape from its bottle, and it becomes problematic to get it back in. In other words, the damage caused to lower inflation may be greater than a higher inflation cycle. This would be a boon for gold either way.
The Fed has changed its stance from dovish to hawkish in acknowledgement that it cannot let inflation run unchecked. This change is now in line with market expectations, and it will complete its bond buying programme by March 2022, and it expects to hike the cash rate three time in 2022 with time not given.
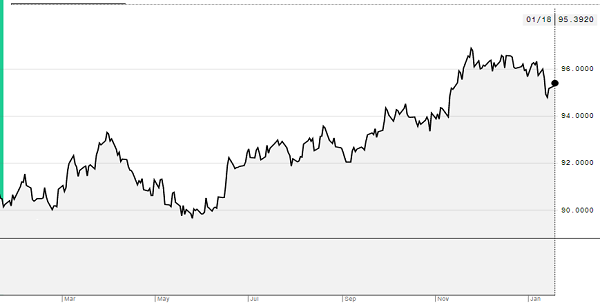
Looking at the US dollar, and we have consistently held to the view that the US dollar would fall, it has run against our call and moved higher. The following chart shows 12 months of the US dollar index:
Source: Bloomberg
The index has over the year risen by 5.5%, to 95.8 and has placed pressure on the gold price rallying, due to the inverse relationship between the two. We believe however that gold, although lower has in fact sustained the pressure from a rising US dollar very well.
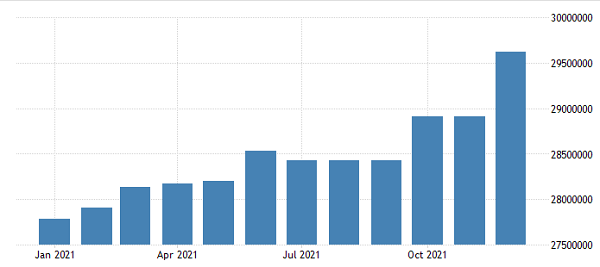
Our view that the US dollar will fall is predicated on a rising US debt pool. Government debt in the US continues to run at record levels, as the uplift in spending is funded through debt. The following chart shows the growing US debt pool (in US dollar millions):
Source: TradingEconomics
The difference to the last chart we proved are the last two columns that clearly show US debt is on the rise. Expectations are that US debt will hit the US$1.0 trillion level in 2022 and the highest level on record.
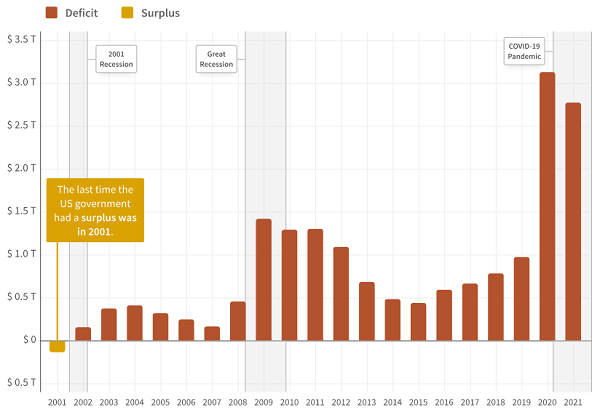
The “cash splash” by the US government has not changed, with President Biden negotiating a new US$1.75 trillion package to vastly expand social and environmental programmes in the US. This package will push the 2021 US budget deficit to around the US$2.8 trillion and the second highest on record. The following chart shows recent US annual budget deficits:
Source: Datalab
The US Congress passed a US$3.4 trillion US Federal budget for 2022. Such programmes are a real boon for the gold price, as it stimulates economic activity and prices and ultimately inflation, as well as boosting US debt.
This rising leverage lowers the value of the US Dollar, as government debt to US Gross Domestic Product hits a record of 133% and is forecast to hold around the 133% level out to 2025. Concerns over US indebtedness will, we believe, be a headwind for the US dollar in 2022.
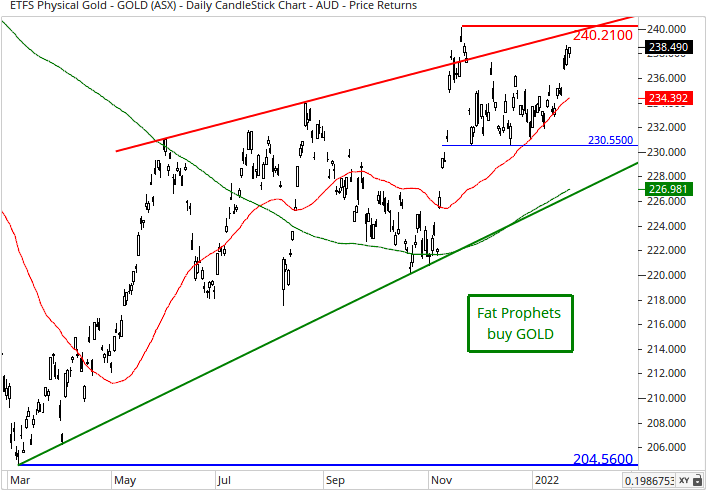
The question of transitory inflation has been answered, with the Fed finally recognising that a problem is brewing and has now turned hawkish on high inflation. All the metrics except for the US Dollar have moved in favour of a rising gold price. We believe the US dollar cannot hold out against this swelling data pool in 2022. Consequently, we maintain our view that gold will retest record highs in 2022.
We believe the Gold Bullion (ASX:GOLD) offers a simple, cost-effective and secure way to leverage into our gold thematic through holding Gold Bullion, as it provides a return equivalent to the movement in the spot gold price less the management fee.
The management fee is acceptable at 0.40% per annum, given the requirement of GB to hold and deal in physical gold and is competitive with other offerings of a similar type.
GB is designed to mimic its benchmark, which is the LMBA Gold Price PM US Dollar index. The performance of GB to 31 December 2021 is shown in the following table (returns for the periods longer than one year in the trailing returns performance table, are annualised):

Source: State Street
GB has consistently tracked the performance of its underlying index less its Management expense ratio (MER). In several instances GB has added value with a return less than its MER relative to its benchmark index. We are comfortable with GBS’s tracking error to its performance index.
GB is backed by physical gold held by JP Morgan Chase Bank as the Custodian. We have no concerns around the suitability and financial strength of JP Morgan Chase Bank. GB like holding physical gold does not pay a dividend and holds no gold or currency hedging positions.
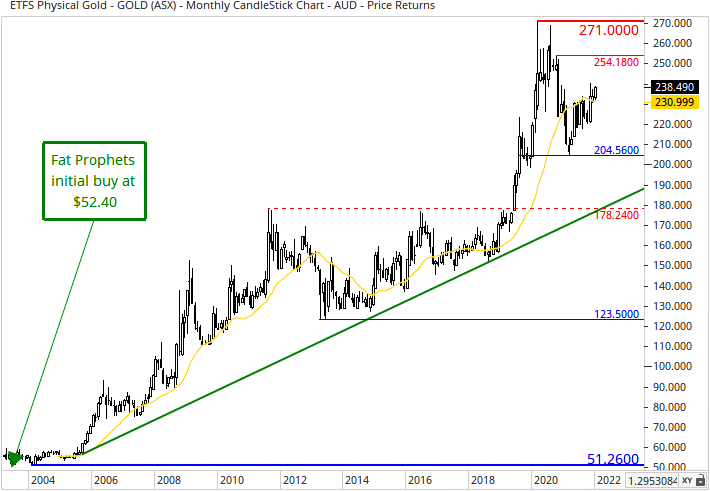
Given our positive gold thematic for 2022, we recommend Gold Bullion (ASX:GOLD) as a buy for Members without exposure and seek the security of safely holding physical gold.

