
An asset sale masks’ a good June quarter
Evolution Mining (ASX:EVN) has reported its June quarter operational numbers, with the sale of its Edna May mine masking what was a good result. The Mt Rawdon mine was the standout for the quarter, with the Cowal and Ernest Henry mines reporting modestly higher gold production. Operating costs took a step back from the recent positive trend, to increase modestly for the June quarter. Furthermore, the balance sheet marches from better to better, on strong June quarter cash flow numbers.
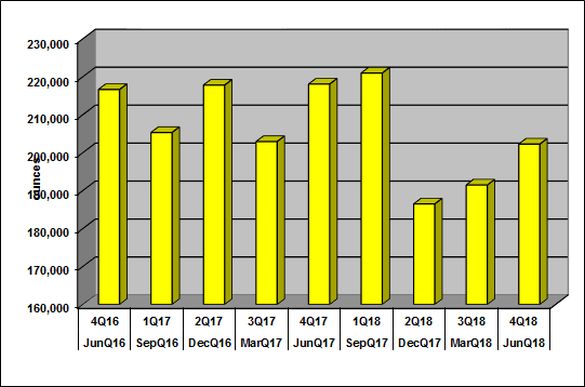
Headline numbers for the June quarter showed a fall in gold production of 7.3% compared to the same quarter in 2017, to 202,254 ounces of gold. The following chart shows quarterly gold production:
Source: Evolution Mining (ASX:EVN)
Behind the fall in gold production was the sale of the Edna May Mine which contributed 21,108 ounces of gold in the June quarter 2017 result. Comparing like-for-like gold production, by removing the Edna May numbers from the previous years’ result, adjusted gold production for the reported quarter rose by 2.7%, to 202,254 ounces.
On 2019 guidance, the company is forecasting gold production to be in the range of 720,000 to 770,000 ounces.
As a by-product, the company produced 223,738 ounces of silver for the reported quarter, representing a fall of 19.4% on the corresponding quarter in 2017. The Edna May mine contributed 7,899 ounces of silver in the June quarter 2017 result. On a like-for-like basis, overall silver production excluding the Edna May contribution from a year earlier fell by 17.1%, to 223,738 ounces. The Mt Carlton mine and the company’s biggest silver contributor delivered a fall of 26% compared to the same quarter in 2017, to 88,174 ounces. No production guidance is provided for silver.
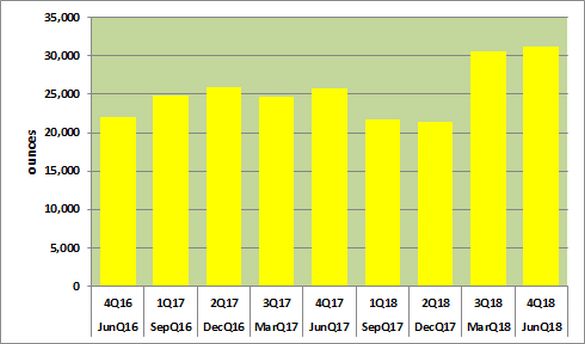
On the gold front, the Mt Rawdon mine was the standout performer, following the reporting of a 21% increase in gold production compared to the same quarter in 2017, to 31,244 ounces. The following chart shows quarterly gold production for Mt Rawdon:
Source: Evolution Mining (ASX:EVN)
Milling efficiencies, gold recoveries and grade were behind the better result, with the gold grade milled coming in at 1.24 grams per tonne (g/t) compared to 1.06g/t from a year earlier. Gold recoveries jumped to 89.4% for the June quarter, up from the 87.5% reported from a year earlier. Mill throughput of ore rose by 2.1% on the same quarter in 2017, to 880,000 tonnes.
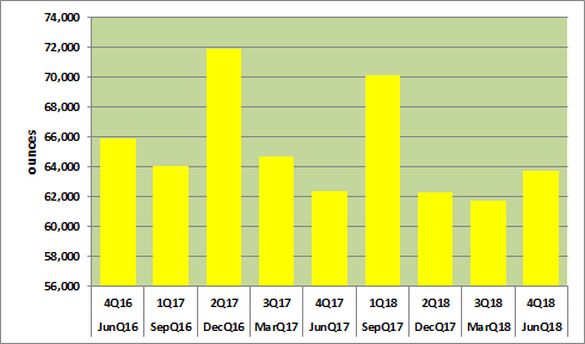
Other positive contributions to production were reported by the Cowal and Ernest Henry mines. The Cowal mine, and the biggest contributor, reported a 2.2% increase in gold production for the June quarter and compared to the same quarter form a year earlier, to 63,777 ounces. The following chart shows quarterly gold production for Cowal:
Source: Evolution Mining (ASX:EVN)
Driving the result for the Cowal mine was higher ore throughput of 2.0 million tonnes, representing a 10.0% increase from a year earlier. Partially offsetting the processing outcome were lower gold grade and recoveries. The gold grade dropped to 1.22g/t gold from 1.29g/t gold from a year earlier, and gold recoveries likewise dipped to 81.8% from 83.0% for the year earlier result. The Ernest Henry mine reported a modest 1.9% increase in gold production compared to the same result from a year earlier, to 24,202 ounces.
Mines that turned in lower numbers for the quarter were Mt Carlton and Cracow, reporting falls of 5.5% and 2.4% respectively and compared to the same results from a year earlier, to 26,708 and 26,145 ounces of gold. The Mungari reported a flat 30,145 ounces of gold for the reported quarter compared to 30,398 ounces from a year earlier.
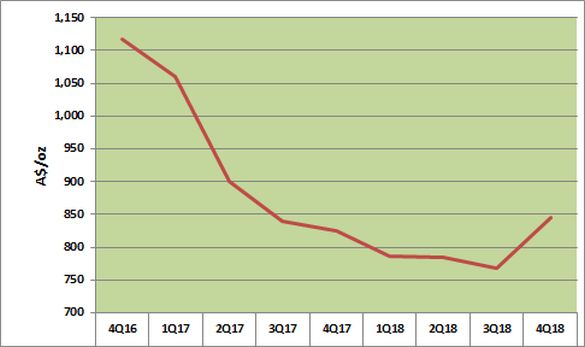
Operating costs were higher for the June quarter result, following the reporting of a modest deterioration. The following chart shows the company’s All-in sustaining (AISC) cost per ounce of gold sold:
Source: Evolution Mining (ASX:EVN)
Operating costs compared to the year earlier result took a step backward, following the reporting of a 2.5% increase in all-in sustaining costs (AISC) to, A$846 an ounce. The June quarter brought with it a good improvement in C1 cash costs of 12.0% compared to the June quarter 2017, to A$499 an ounce. Cash costs improved on better gold volumes and the sale of the high operating cost Edna May mine. AISC reported an increase for the quarter on a higher sustaining capital amount. The allocation to sustaining capital came in at A$174 an ounce compared to A$109 an ounce. The company has acquired additional assets that required in turn a higher sustainable dollar amount.
AISC guidance for 2019 is forecast to be in the range of A$850 to A$900 an ounce.
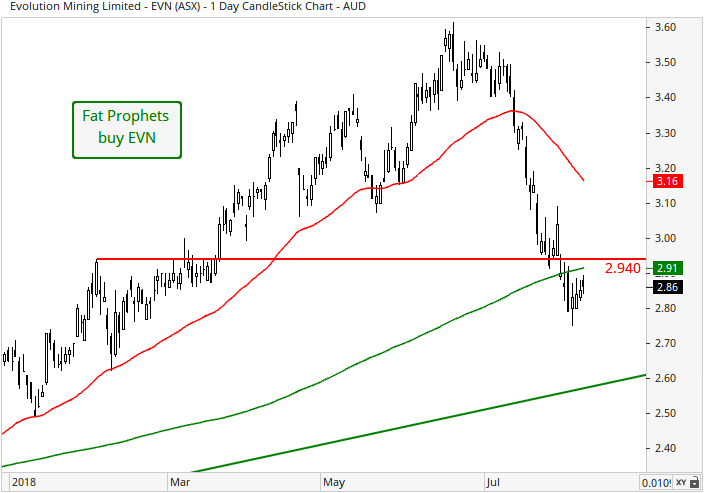
Turning to the daily chart, and after a strong run through to June, the share price of Evolution has corrected in recent weeks. Prices have broken support at the February intra-month high of $2.94 and the 50-day moving and 200-day moving averages. Prices have rotated up in recent days which is positive, but a successful challenge of the $2.94 level is needed to improve the picture.
Net mine cash flow came in at a record A$539.9 million, with three sites hitting records for this metric. Records were reported at the Ernest Henry (A$219.2 million), Mt Carlton (A$108.7 million) and Mt Rawdon (A$49.7 million) mines. The net mine cash flow drove net debt in the balance sheet lower by A$325.8 million from 30 June 2017, to A$71.8 million at 30 June 2018. From the snap shot of the balance sheet provided, we have no concerns over the company’s balance sheet. The company will provide greater clarity around its financials when it reports its 2018 full year results in August.
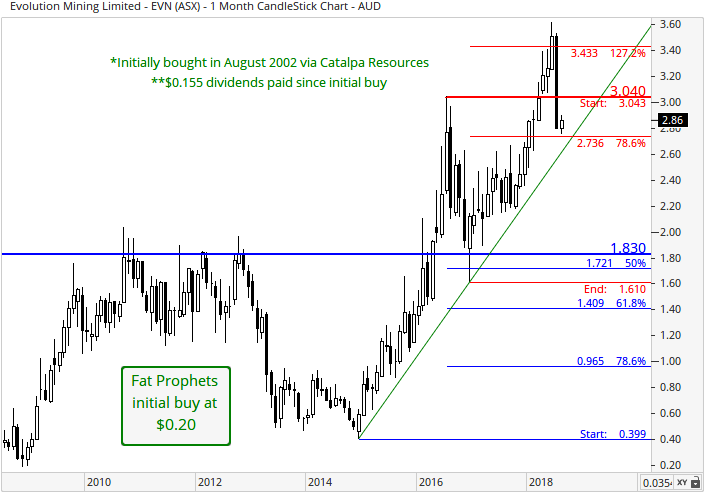
With reference to the monthly chart, a cluster of support was respected between $1.72 and $1.83. This is made up of the 50% Fibonacci retracement (blue set of retracements) and the October 2010, September 2011 and October 2012 resistance (horizontal dashed-blue line) respectively. In addition, a ‘bullish doji’ candlestick pattern formed as of the close of trading in December 2016, which is a sign of positive sentiment to arise over the medium-term. Positively, from a broader perspective, prices have closed (on a monthly-basis) above the 78.6% Fibonacci retracement of $2.74 (red set of retracements) in January. This was a bullish development, as an activation of the next broader term upside target of $3.43 was triggered (127.2% Fibonacci extension). Prices have since corrected form their 2018 highs but long-term momentum is favoured to the upside, with an upward sloping trend-line (in green) still evident.
We believe Evolution Mining has a suite of quality gold assets with brownfield expansion capacity to drive future growth. Moreover, Evolution Mining has a robust balance sheet and cash flow to act as a springboard to deliver its growth opportunities. The June quarter result exemplify the company’s drive to reduce its operating costs to deliver better cash flow and balance sheet outcomes.
Consequently, Evolution Mining (ASX:EVN) continues to be recommended as a high conviction buy for Members with no exposure to the stock.
Disclosure: Evolution Minin (ASX:EVN)g is held within the Fat Prophets Global Contrarian Fund, Fat Prophets Concentrated Australian Share, Mining & Resources and Small & Mid Cap managed account portfolios.

