
Unfazed
Just two weeks ago, BT Financial Group issued what is tantamount to a “declaration of (price) war” across the Fund Platform Industry. Though, as we addressed in our note on HUB24 last week, we believe this to be ultimately an overreaction by the market, with there more than meets the eye to the “price cuts”. That said, we are revisiting the move and providing commentary on the impact on vertically integrated player, Fiducian (ASX:FID).
What’s New?
Last week, in our coverage of a Financial Services peer, HUB24 (ASX:HUB) we provided coverage on one of the more significant developments in the space which has caused quite a storm. BT Financial Group (BTFG), which is the wealth management arm of Westpac Banking Corporation (ASX:WBC), issued a press release on 23rd July that it is reducing prices on its superannuation platform to new customers to a flat A$540 per annum and a 0.15% asset-based administration fee that is capped once assets reach A$1 million.
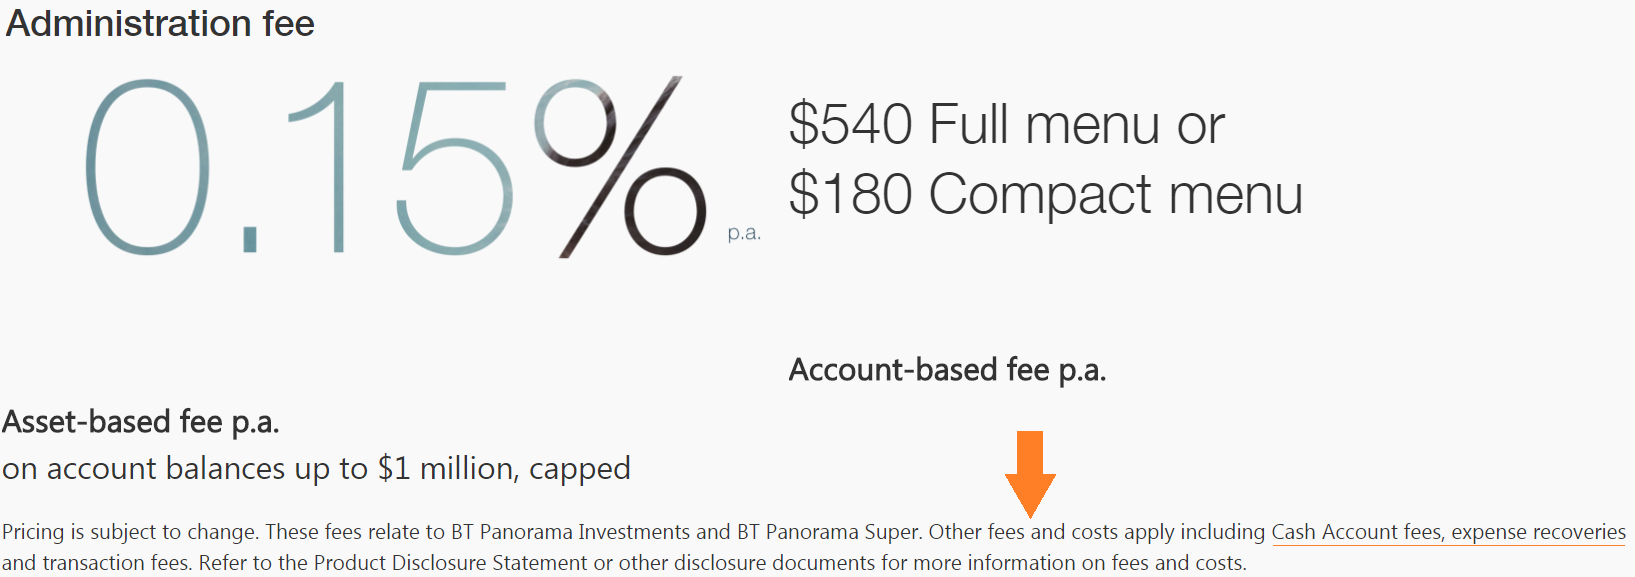
Source: BT Financial Group Website
Unsurprisingly, this resulted in significant downward rerating in peers such as HUB24 (shares are down circa 20% since the announcement), Netwealth (-13%) and Praemium (-4.5%). Market has sentiment shifted downward mainly due to lowered earnings expectations on the back of price war speculation.
But as we’ve revealed in our HUB24 coverage, there is more to this than meets the eye with the actual costs proposed not necessarily lower. In fact the impact depends on the account size – BTFG is actually substantially more expensive for smaller accounts but tapers off as it scales up.
BTFG pricing does favour significantly larger superannuation accounts (>A$100,000) which account for around 21% of the entire population and not representative of the average Australian.
However, it can be argued that superannuation platforms rarely deal directly with retail accounts and prefer to do a substantial amount of their business with Financial Advisers (Adviser) which makes the aforementioned argument weaker.
We do note that this isn’t entirely representative of Financial Advisory clients. In fact, based on the initial findings of a recent survey of over 1000 Australian Advisers by Adviser Ratings, the majority of financial advisors are willing to deal with clients that have more modest account sizes. This is reflected in the graphic below:
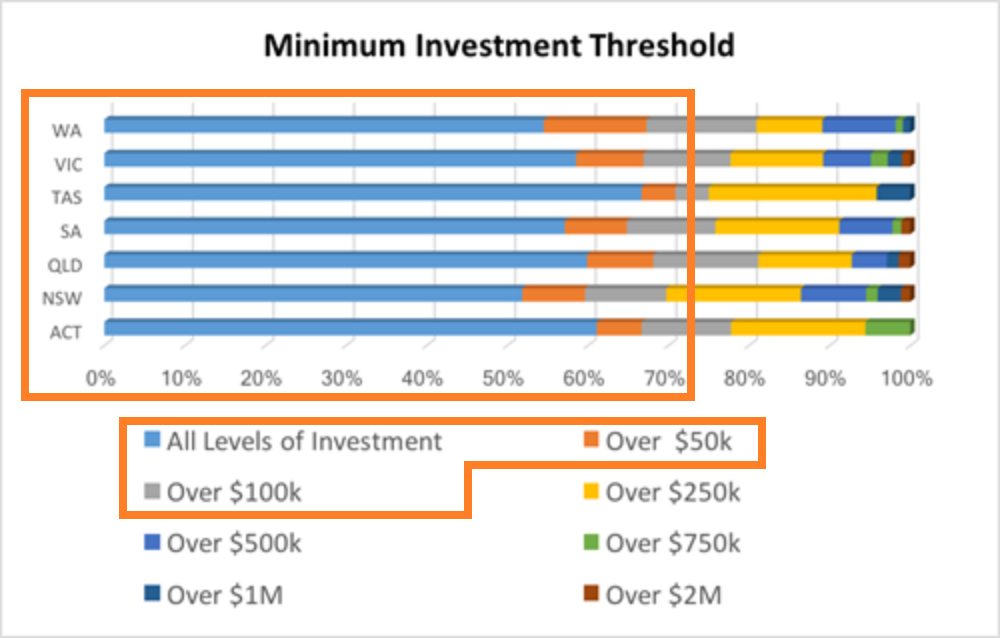
Source: Adviser Ratings Website
But to have a clearer picture, we revisit BTFG’s pricing and compare this with Fiducian’s offerings. First off, a look at BTFG’s Product Disclosure Statement (PDS) and how it applies fees. The graphic:
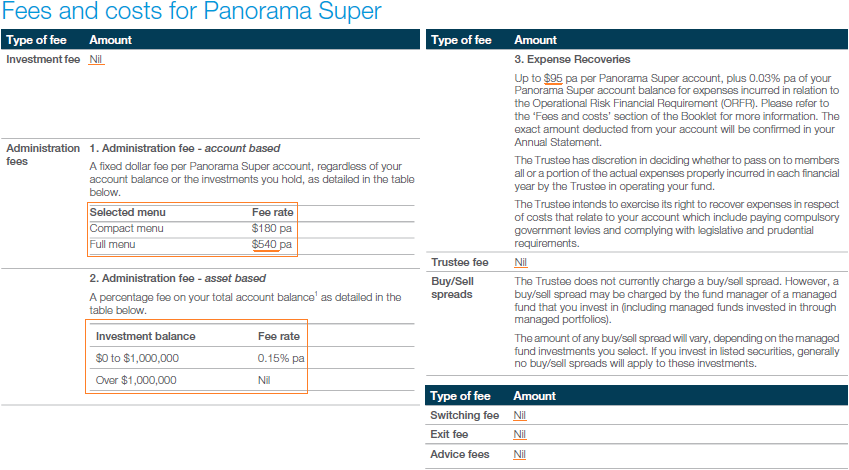
Source: BTFG Panorama Super PDS
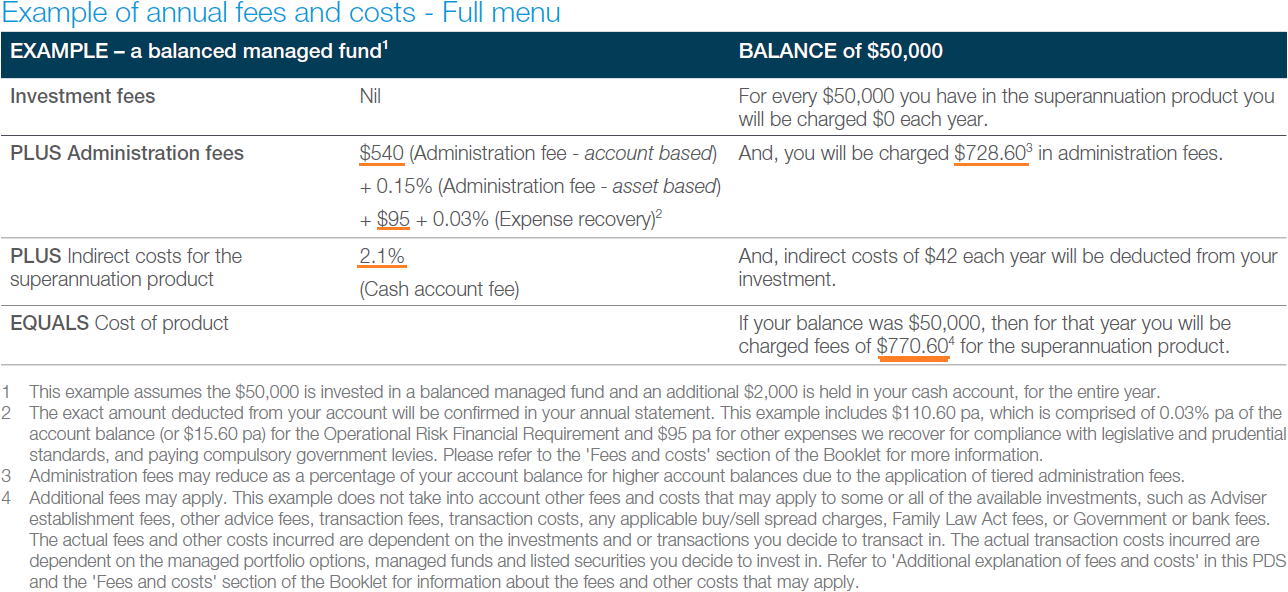
A look at the boxed section does show that the fee implementation is consistent with the marketing that there is a flat fee (A$180 or A$500) and a variable rate (~0.15% p.a.) depending on the account size. Though what wasn’t directly advertised is the significantly higher expense recovery of A$95 which can significantly drag down returns on more modest account sizes. Note that the pricing is consistent across all BTFG fund products.
Now, compare this Fiducian’s offerings which are varied and have different cost structures depending on the fund. Considering that, we will be commenting on more general strokes with comparisons using the Balance Fund as similar to BTFG’s PDS Filings.
Fiducian (ASX:FID) has 13 Actively Managed Funds split across 3 broad strategies namely: (i) Fiducian Diversified Funds which are predicated on broader strategies/objectives such as Capital Stability, Growth or Balanced strategies. This is followed with the (ii) Fiducian Sector Funds which invest mainly on sector (Property, Small-Cap) to country (Australian, International) exposures.
The last category, (iii) Fiducian Specialist Funds, which invest on specific niche strategies such as Technology to high-risk exotic exposures such as “Global Small Co’s & Emerging Markets” or even ethical investing under the “Diversified Social Aspirations” fund. Unsurprisingly, considering the narrowness of such strategies and subsequent lower scale, these tend to have the highest fees at a total average cost of 1.52% per annum versus the 1.45% in Sector Funds and 1.32% in Diversified.
The graphic below, provides a specific example (Fiducian Balanced Fund) on how it prices:
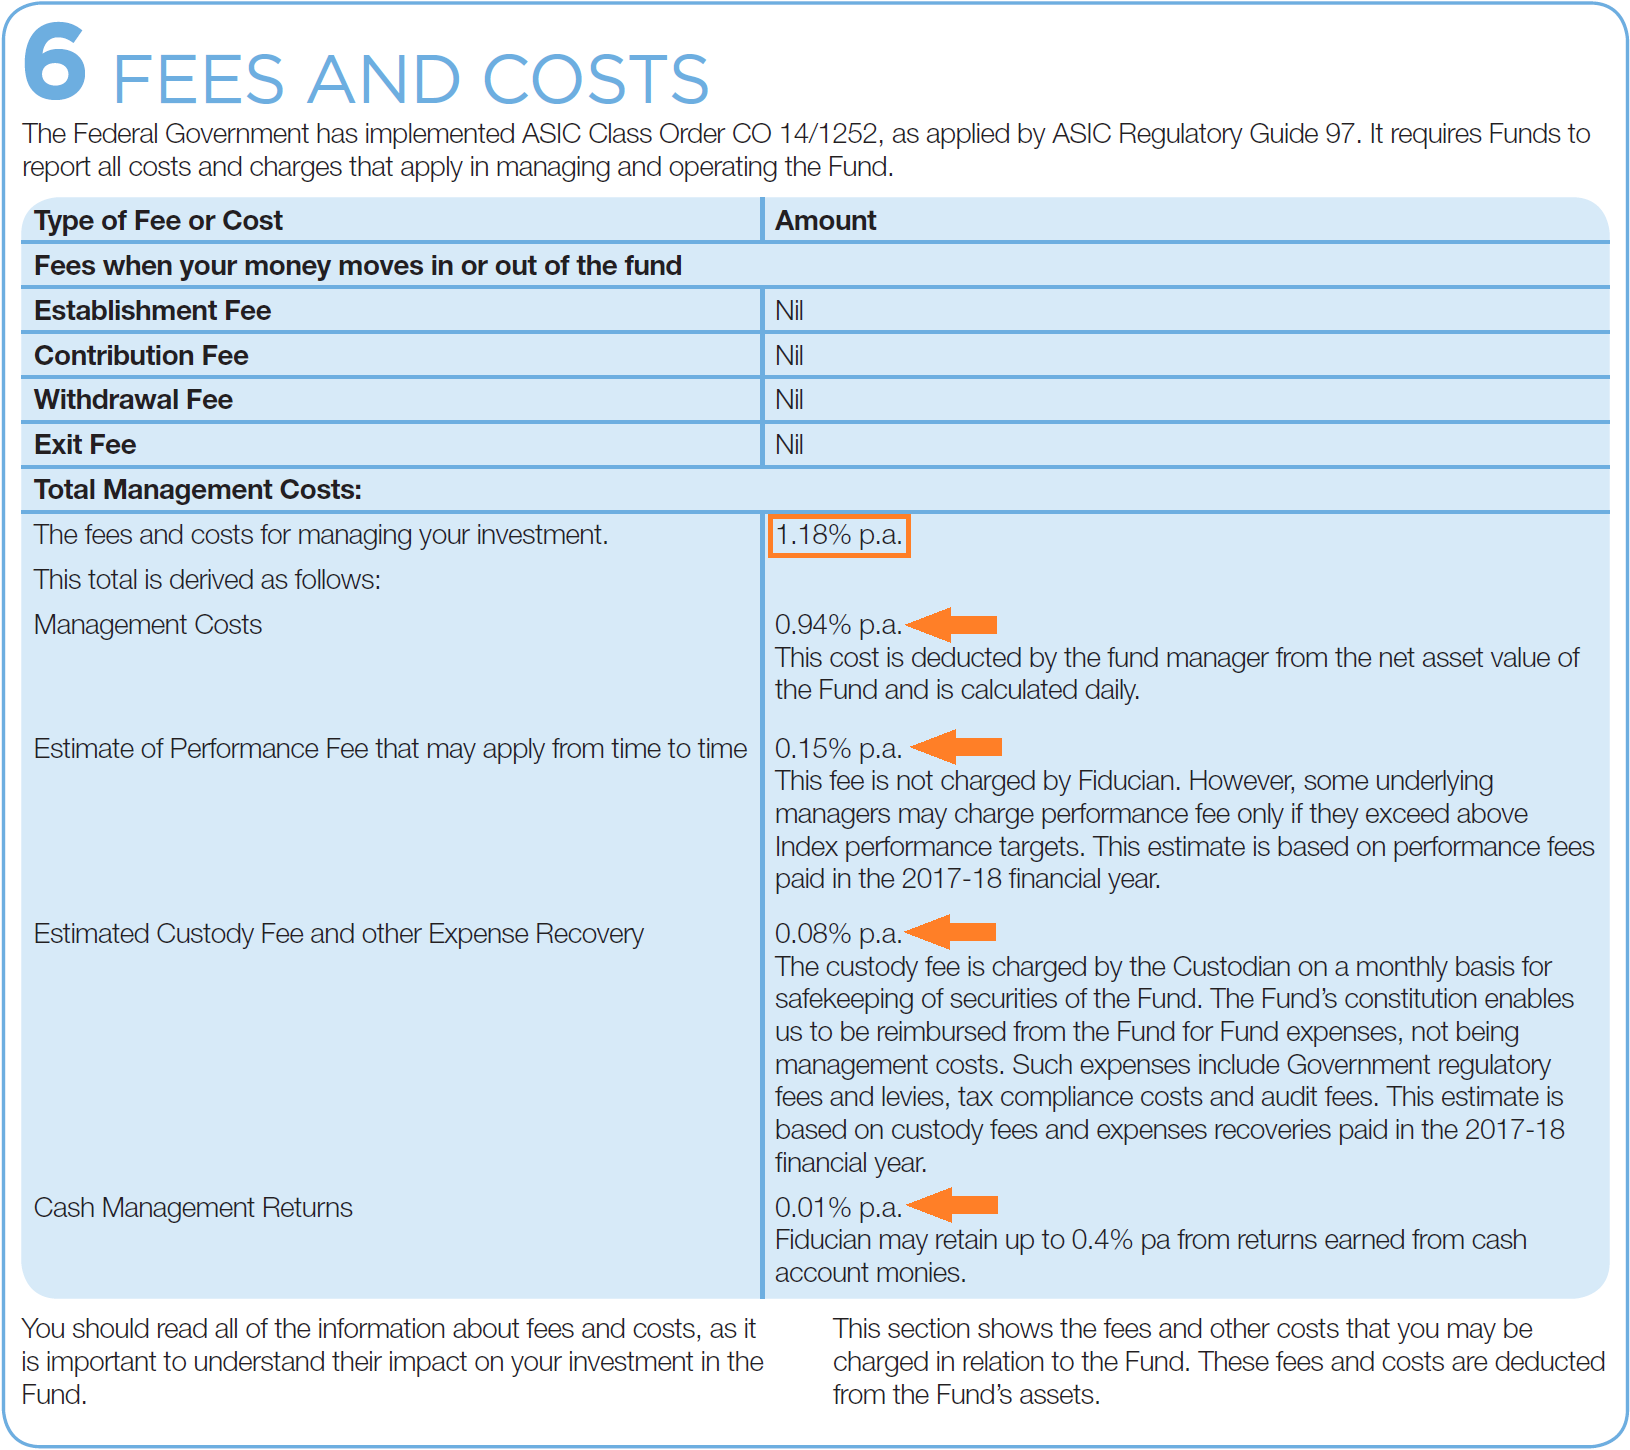
Source: Fiducian Balanced Fund PDS
As shown in the graphic above, the fees are split between Management Costs, Performance Fees – why vary from fund-to-fund with some having no fee, to Custody Fee & Expense Recoveries which could go as a low as 0.04% to as high as 0.29% (Geared Australian Fund) depending on the costs in running a fund, and the Cash Management Return which is based on interest from cash accounts and capped at 0.4% across all funds (actual highest: 0.03%) though could be as low as 0% if the fund is fully invested.
Considering the significant variety of pricing based on the fund type, we believe the appropriate focus is on the floor which varies depending on the Adviser distributing it. A perfunctory search through Morningstar’s Fund Report system shows the average Minimum Investment is A$2,000 which could very well mean only a cost of A$23.6 which is quite affordable compared to a significantly higher flat fee.
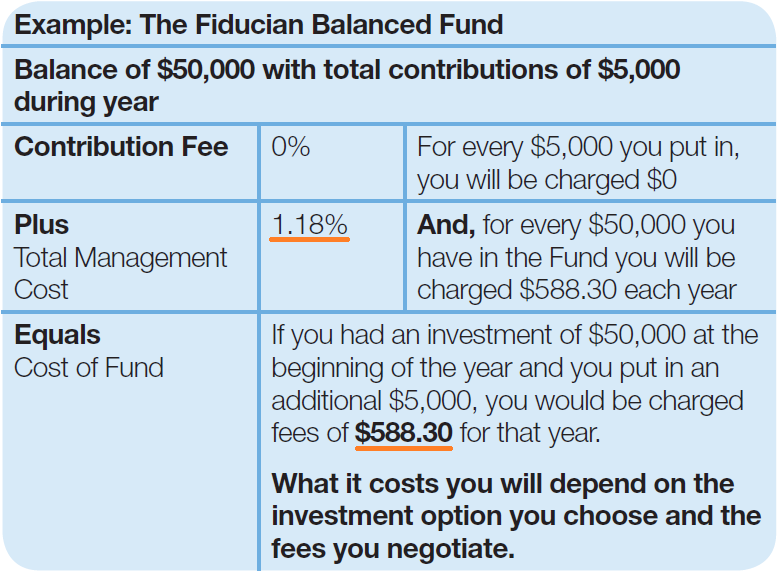
Moving on, to further concretise the differences, as required by regulators both funds via their respective PDSs showcase an example of costs incurred in a A$50,000 account in both balanced funds:
BTFG Case:
Source: BTFG Panorama Super PDS
While Fiducian’s example is presented below:
Source: Fiducian Balanced Fund PDS
As outlined in the example above, the BTFG cost structure is significantly (>30%) more expensive compared to Fiducian’s offerings and note that this includes a A$5,000 addition bringing the account size to A$55,000, and doesn’t even budge the expense figure.
Though, we do admit that the flat cost structure of BTFG does become more economical as the investment account scales up, however, considering that over 80% of the population in Australia don’t have account sizes over A$100,000, the offerings of other services are significantly more affordable.
An additional side benefit (in retaining market share), in our view, is the fact that Fiducian houses numerous highly rated (4- & 5- star) funds based on the findings of Morningstar based on the relatively low fees, consistent outperformance of its benchmarks and lower volatility.
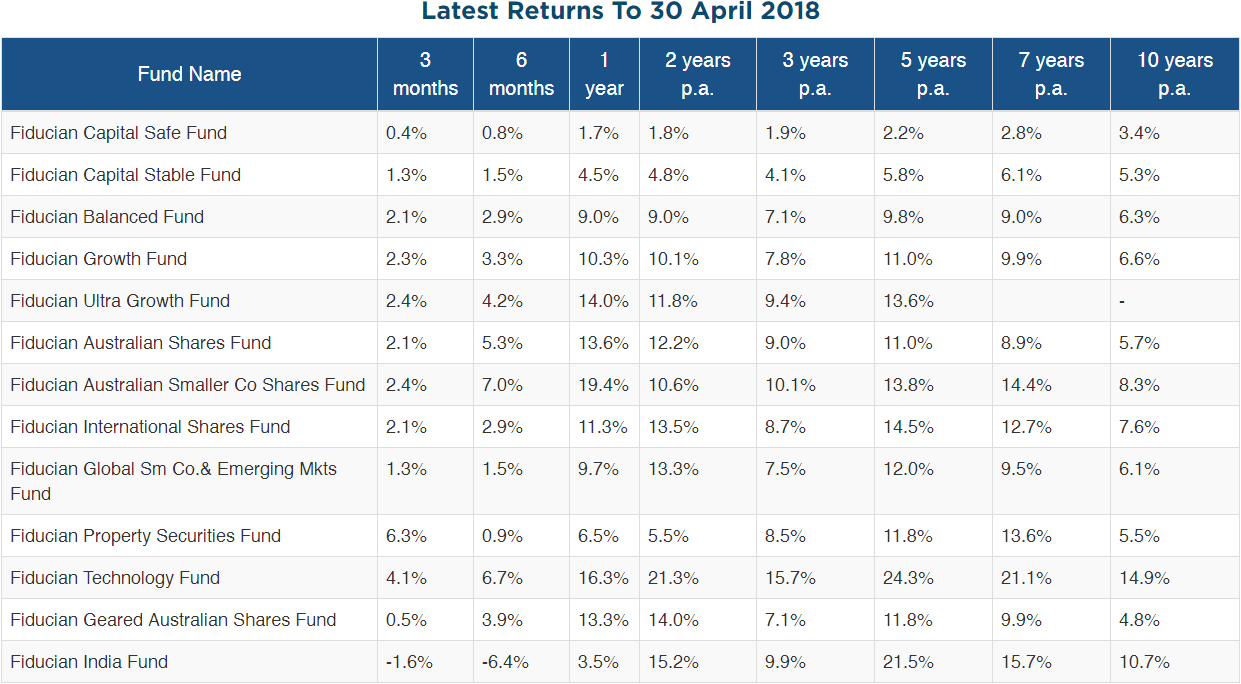
We also did a comparison of 1-year, 3-year and 5-year investment returns for Fiducian’s Balanced Fund versus BTFG’s (30 versions) Balanced Funds and Fiducian’s results outperform all versions across time periods covered. We believe this superiority does lend well to the stickiness of assets under management (AUM) in favour of Fiducian.
A sampling of Fiducian’s latest returns:
Source: Fiducian (ASX:FID) Company Website
In addition to better fund performance, Fiducian is one of the most vertically integrated operations servicing Advisers covering “Fund Management” to “Financial Planning” and even “Accounting Process and Support services” that also includes acting as a Tax Agency.
This, we believe, gives Fiducian a “switching costs” advantage given the convenience they provide from the vertical integration as well as having an attractive mix of high performing funds creating significant “stickiness” to the existing customer base (advisers) while simultaneously maintaining its own niche to attract new Advisers.
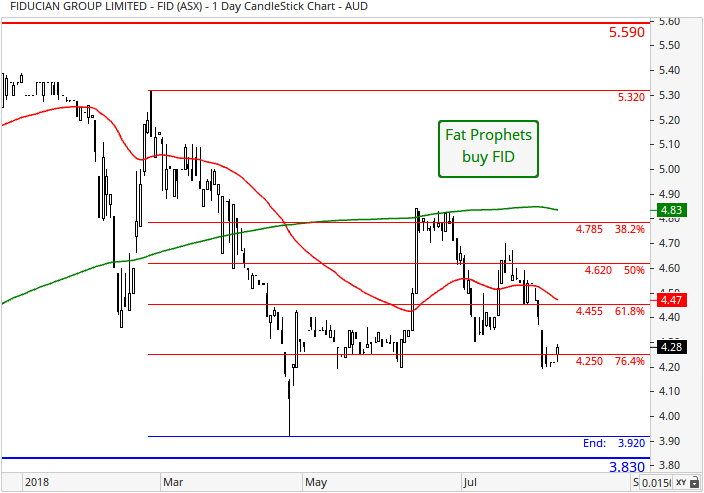
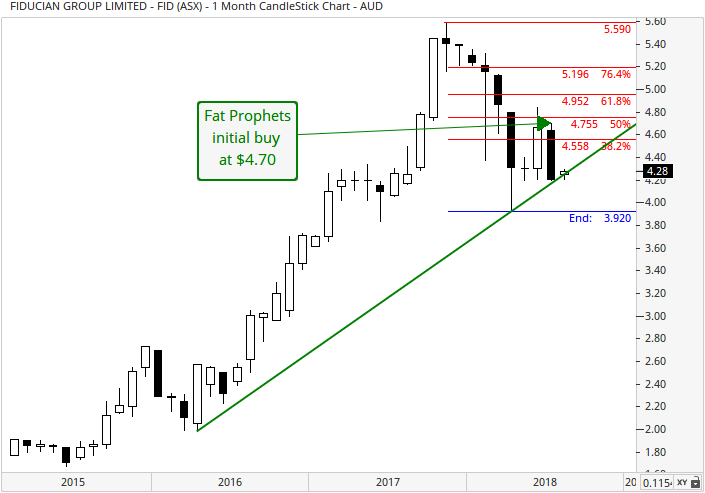
Turning to the charts, on the daily, a rotation north in June has proved ephemera with several Fibonacci levels (red set of retracements) giving way since our last coverage. Encouragingly prices have recently reclaimed a layer of support existing at the 76.4% Fib level of $4.25. This will be a pivotal point near term, and will need to hold to prevent a dip back towards the April low of $3.92. On the other side a move back above prior Fib levels and clearance of the 200 and 50 day moving averages would strengthen the outlook and bring the March high of $5.32 into focus.
On the monthly chart, the longer term upward trend line has remained intact on the recent pullback, and is currently being tested. A further push above this would be an encouraging event from a technical perspective.
Summary
BT Financial Group’s (BTFG) new pricing model, which implements a flat fee structure, has undermined sentiment in the platform segment, with investors expecting a “price war” and many players losing market share. This sets expectations for BTFG to come out on top as having struck first while having a large bank (Westpac) as a backer.
However, we disagree on this premise. Though we do admit that the “price cut” will have an impact and could lure away much larger investment accounts looking for an edge in returns by lowering costs, we do believe that ultimately in Fiducian’s case, its superior offerings will win out while its vertically integrated structure give it a robust “moat” to protect against the attack.
On the valuation front, we find that the company is modestly valued, trading at 17.0 times FY18 forecast earnings versus the sector median’s 13.4 times. We believe this is reasonable given the growth on offer. The company also gives an attractive dividend yield of 3.9% which is higher than sector media of 3.4%.
Accordingly, we maintain our BUY rating on Fiducian (ASX:FID) (and recommend the stock as a BUY to members without exposure.
Please also note that shares are small cap in nature and patience should be exercised in setting up a position.
Disclosure: Fiducian (ASX:FID) is held in the Fat Prophets Small/Mid-cap managed account portfolio.

