
Ahead at the halfway mark
Saracen Minerals (ASX:SAR) continues to enjoy a kick in gold production from its two operating mines in Carosue Dam and Thunderbox, following the release of its December quarter operational results. A December quarter record was set for gold production while all-in sustaining costs continue to improve. The company remains on track to come-in ahead of 2018 guidance, which was left unchanged post the December quarter result. The following chart shows quarterly gold production:

Source: Saracen Minerals (ASX:SAR)
Gold production for the December quarter rose by 17% compared to the same quarter in 2016, to a December quarter record of 77,522 ounces of gold. Both the mines contributed to the quarters’ performance, with the Thunderbox mine the standout.
The Thunderbox mine produced 37,152 ounces of gold for the December quarter, which represents a significant increase of 30% on the December quarter 2016. Gold production for the quarter was just shy of the record set in the September quarter 2017, with the mine now successful ramped up following commissioning. Mining and milling efficiencies and higher gold recoveries delivered the impressive outcome for the quarter. Gold recoveries improved to 93.6%, up from the 92.2% reported for the December quarter 2016.
Carosue dam delivered a more modest 7.1% increase on the December quarter 2017, to 40,370 ounces of gold. Driving the result for the mine were mining efficiencies, higher gold grades and gold recoveries. Milled gold grades came in at 2.1 grams per tonne (g/t) for the reported quarter compared to 2.0g/t from a year earlier. Gold recoveries also improved to 93.1%, up from the 92.6% reported for the December quarter 2016.
Guidance for 2018 remained unchanged at 300,000 ounces of gold.
At the current production run rate, the company will likely come in with annual gold production ahead of its forecast target for the year.
Higher gold production and other cost saving initiatives delivered an improvement in all-in sustain costs (AISC) for the reported quarter. The following chart shows quarterly AISC:

Source: Saracen Minerals (ASX:SAR)
AISC for the December quarter turned in significant 17% improvement compared to the same quarter in 2016, to A$1,176 an ounce. AISC is forecast to be A$1.150 an ounce for 2018, and remained unchanged.
The company reported an average realised gold price received for the quarter of A$1,600 an ounce, which was 1.6% lower when compared to the same outcome from a year earlier. Despite the softer gold price, the better operational result delivered a nice surge in revenue for the quarter. The following chart shows quarterly revenue:

Source: Saracen Minerals (ASX:SAR)
Revenue for the reported quarter jumped by an impressive 70% compared to the December quarter 2016, to A$118.9 million. We retain a positive outlook on the gold price for the year-end 31 December 2018. Expectations of higher inflation in the latter part of 2018 and rolling into 2019 will be a key tailwind for the gold price. Furthermore, a weak US Dollar, despite likely cash rates increases, on rising debt could also act as a tailwind for the gold price. We expect the gold price will close the calendar year out in the range of US$1,550 to US$1,600 an ounce. The company also delivered 93,800 ounces of gold through its hedge book, of which 50,000 ounces delivered at A$1,728 an ounce and 43,800 at A$1,555 an ounce.
At 31 December 2017, the hedge covered 246,343 ounces of gold at an average delivery price of A$1,636 an ounce. Given a current Australian gold price of A$1,669 an ounce, the average delivery price position is “out-of-the-money” and is therefore not profitable. We hold no concerns over the positon, given the volatility in both the gold price and the Australian Dollar/United States Dollar exchange rate.

Turning to the daily chart, a short-term correction has evolved. Should this continue over the near-term, then initial support is sighted at the December 2017 low of $1.45 (horizontal blue line), followed by the 200-day moving average (green line) of $1.32. Positively, from a broader perspective, and as the dominant trend is clearly favoured to the upside, we would expect prices to eventually gravitate towards the January intra-month high of $1.79 as shown by the horizontal red line. Furthermore, from a medium-term momentum perspective, this remains in favour of the bull-camp as backed by the bullish moving average crossover present since July 2017. This occurs when the 50-day moving average (red line) crosses above the 200-day moving average (green line).
Cash and equivalents totalled A$82.9 million at 31 December 2017, and its constituents were cash of A$65.3 million, gold bullion in transit of A$10 million and investments A$7.6 million. The equivalent 31 December 2016 cash and equivalents stood at A$43.9 million. The improved cash position is despite the company spending A$15.6 million on expansion and exploration programmes. We firmly believe the company has the cash resources and the revenue from gold sales to support its ambitious exploration programme. The company is debt free.
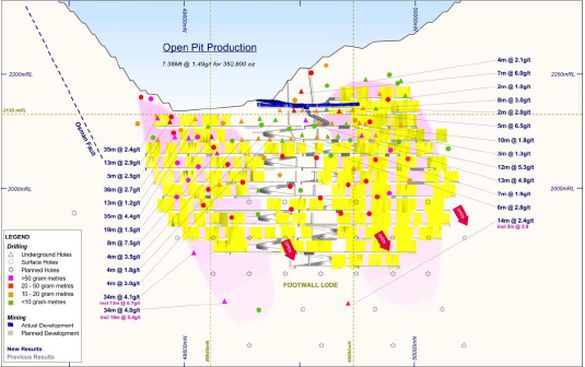
With gold production trending higher, Saracen is not resting on its laurels, given the prospective nature of the near-mine regions at both the Carosue Dam and Thunderbox sites. An ongoing exploration activity at Carosue Dam’s Whirling Dervish prospect as shown in the following figure continues to return very positive results:
Source: Saracen Minerals (ASX:SAR)
Some of the better results from recent drilling at Whirling Dervish include 14.4 metres graded at 2.4g/t, 34 metres graded at 4.2g/t gold and seven metres graded at 5.3g/t gold. These are significant intersections as to grade, seam width and certainly location, with the mineralisation yet to be closed off at depth. Further drilling will, we believe, continue to add to the value of the Whirling Dervish mineralisation and Carosue Dam.
Thunderbox has not been left out, with recent results from the Kailis mineralisation returning significant results with the better being 21 metres graded at 38.4g/t gold and 15 metres graded at 37.7g/t gold. Again, these are significant results on grade, seam width, and location.
Further drilling at both sites is ongoing, and will we believe continue to reinforce the prospective nature of each site.
We look forward to reviewing further results as these come to hand. It is this ongoing exploration success that adds further value to the Carosue Dam and Thunderbox sites.

With reference to the monthly chart, structural support was respected at the $0.85 region in December 2016 as marked by the horizontal solid-blue line. This is a positive development, which also resulted in a ‘bullish doji’ candlestick pattern to form. In effect, this translated to a stern upward trajectory in the share price until early January (i.e. current month). Furthermore, prices have closed (on a monthly-basis) above the 78.6% Fibonacci retracement (red set of retracements) of $1.63 in December 2017. As a result, an activation of the next longer-term upside target of $2.15 is triggered being the 127.2% Fibonacci extension. An eventual longer-term gravitation towards this price point would potentially be on the horizon, moving forward.
With the financial clout to deliver exploration programmes and the prospective nature of the two regions where mines are located, warrants our ongoing support for the company.
Consequently, we continue to recommend Saracen Mineral Holdings as a high conviction buy for Members with no exposure to the stock.
Disclosure: Saracen Mineral Holdings (ASX:SAR) is held within the Fat Prophets Concentrated Australian Shares portfolio.

