
Taking the wheel
Real estate agent McGrath (ASX:MEA) did not have a happy time of it in 2017, with revenues and earnings under pressure on the back of a low level of listing volumes, and compounded by key high profile departures. This ultimately culminated in a profit warning for FY18 which we covered off in our last review.

Source: Company Presentation
Pressure has certainly been made to bear on management, and for founder John McGrath and his Board who have had a baptism of fire in the public eye since listing in late 2015.
The much-vaunted revival in listings has been ‘coming for some time’, and it is understandable that the longer it dragged out, the more extensive the management action that would need to be taken. Cost cutting around the edges was probably only going to mitigate bottom line attrition slightly. That said, the revelation last week that much of the company’s Board was resigning was somewhat extreme to say the least.
In tandem with a downgrade to earnings guidance, McGrath (ASX:MEA) announced ‘significant changes to the Board and executive team.’ CEO Cameron Judson, Chairman Cass O’Connor, and other directors have resigned en masse, with a pending transition to John McGrath as interim executive Chairman.
Nigel Dews (who has been made CEO of Message Media) is leaving the Board as is the Head of Corporate Services Morgan Sloper. Non-executive directors Elizabeth Crouch and Cath Rogers are also resigning; orderly transition periods are being followed in each case. The departures have largely been painted as part of Stage Two of the company’s structural review, examining costs in non-customer facing roles. John McGrath will assume the role of Interim Executive Chair after the half year results.
The company has had a couple of years to forget since listing two years ago, but notwithstanding the Board and executive departures, there does appear to be some signs of light
. Half year EBITDA to 31 December is set to come in at $1.63 million, and the loss post one-off items is set to narrow to $50,000, excluding any goodwill impairments. Full year EBIT is expected to be in the range of $5.8 – $6.8 million after one-off items.
That said, the new guidance is also in stark contrast to forecasts given late last year. Only in November the company indicated that (in the absence of a cost out program)
FY18 earnings could be 20-25% lower than the then current analyst estimate of $16.6 million. On a full year of cost savings the result would be within 10% of that estimate.
This has seen a ‘please explain’ notice from the ASX as to the timing of revised estimates. McGrath’s Board has noted that it was first presented with a draft full year forecast on 19th January 2018.
McGrath (ASX:MEA) has certainly had to react to a challenging market, and has noted that half year earnings have been adversely affected by the underperformance of the company owned sales, including Project marketing. Other divisions are performing according to expectations, but it is this unit which is the key driver of revenues as shown below:

Source: Company Presentation
The company has clearly had to react, and take out significant costs, with around $5 million removed on a full year basis (with Board costs also set to fall). Management believes this will effectively translate into full year underlying earnings going forward of $10.6 to $11.6 million. With McGrath now capped at just over $60 million this leaves scope for a re-rating if Ms O’Connor’s claims are correct that “the issue of historically low listing volumes seems to be abating.”
The question now is whether John McGrath pushes the button on a privatisation, or is comfortable retaining control within the public eye.
His commitment to the business is certainly not in doubt, if a presentation to 1000 agents and team members at company’s annual “kickstart” event at Royal Randwick Racecourse is anything to go by.
Mr McGrath remarked that “We will be moving forward at a pace not seen before. This business has incredible greatness and resilience…We will be laser-focused, customer-centric, fast, agile and our innovative heritage will once again come to the fore.”
There is a lot to be said in leading from the front, and the costs that have been taken out will certainly make McGrath a leaner beast. The company also clearly possesses a strong brand in the Australian real estate market. The key variable though remains when will further anecdotal evidence that listings are improving, proves substantive. The company has given itself more time in this regard, and we are also prepared to give McGrath more rope.

Source: Company Presentation
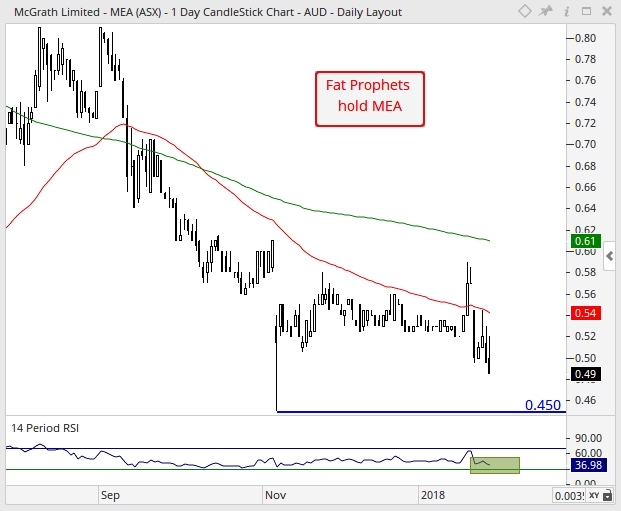
Turning to the charts, and on the daily chart, support is evident at the November low of $0.45 as marked by the horizontal blue line, if the bears were to maintain downward pressure over the near-term. Positively, from a relative strength (RSI) perspective, this indicator is within range of oversold territory. This is suggestive of an exhaustion in short-term selling pressure, and hence, would be fair to say that a turning point or period of price stabilisation is near. Overall, and in order for the short-term technical outlook to strengthen, a sustained break above the 200-day moving average (green line) of $0.61 is required. If this was to occur, then this would shift momentum back in favour of the bull-camp.
With reference to the monthly chart, an all-time low of $0.45 was printed in November 2017. Positively, a ‘bullish doji’ candlestick formation evolved, which is suggestive of a potential change in momentum on the horizon. For this to be confirmed, a sustained break above the highest price of the ‘doji’ of $0.61 (as shown by the horizontal dashed-red line) is required. Should this favourable scenario unfold, then a lift in medium-term positive sentiment is likely to follow towards resistance situated between $0.77 and $0.87. This is made up of the 38.2% and 50% Fibonacci retracement levels as represented by the thin-red set of retracements respectively. However, it should be noted that the long-term downtrend remains in play, and therefore gains are likely to be slow in coming.

McGrath (ASX:MEA) will remain held in the Fat Prophets Portfolio.

