
Putting the Pieces Together in the Right Space
From a thematic perspective, we like Australia’s growing financial services industry as a pool to fish in for investment ideas. Deloitte has forecast Australia’s superannuation system can hit $9.5 trillion in size by 2035, representing an impressive annual compound growth rate of 8.1%. IOOF Holdings (ASX:IFL) deal to acquire ANZ Bank’s wealth management business late last year will see it well positioned to grab a bigger slice of the industry revenue opportunity going forward, supporting solid organic growth.
1Q18 FUMAS (Funds Under Management, Administration, Advice and Supervision) update
IOOF (ASX:IFL) had positive net flows of $669 million in FUMA (Funds Under Management, Administration and Advice) in the first quarter of the fiscal 2018 year (i.e. the three months ended September 2017). Total FUMA at the end of the quarter totalled $115.2 billion, while funds under supervision stood at roughly $32.5 billion. The following graphic provides the breakdown of funds by segment.

Source: IOOF Holdings (ASX:IFL)
The quarter marked the 19th successive quarter of positive platform net inflows, at $309 million. Organic growth in the flagship platforms continued with a net inflow of $364 million in the quarter.
Advice flows were positive to the tune of $512 million in the quarter and total funds under advice from the 38 advisors who have joined the group from another licensee was roughly $1.2 billion at the end of the quarter. IOOF management believes that the company’s ‘open architecture’ and advice-led strategy make it appealing to advisors. In July 2017, 14 of the top advisors in Barron’s inaugural survey of Australian financial advisors were IOOF employed or aligned. That was more than any other company according to IOOF.
Net investment management flows were outflows ($152 million) in the quarter, impacted by the timing of distributions. IOOF attributes this to distributions often resulting in a lag to reinvestment, while waiting for clients’ instructions. The following table provides the fund flow movements for the quarter.
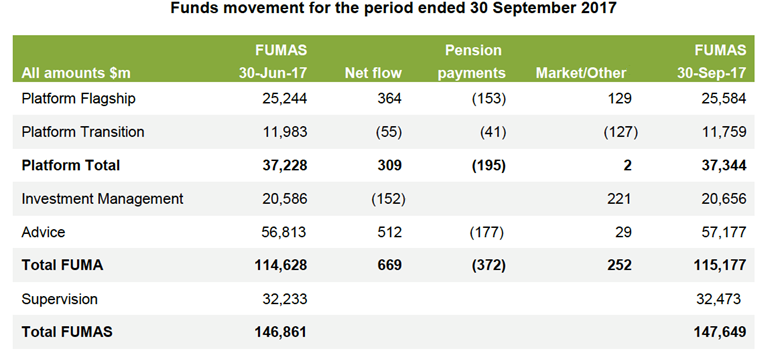
Source: IOOF Holdings (ASX:IFL)
That comes on the heels of an impressive FY17, when IOOF had $4.6 billion of net inflows, marking an increase of 156% over FY16.
A transformative deal
IOOF recently saw its stock upgraded by Morgan Stanley, with the broker forecasting an “upgrade cycle” and lifting its earnings estimate for the company following on the heels of its $975 million deal to buy ANZ’s wealth management business.
We covered this in detail in prior coverage of IOOF, but to recap briefly, we are very positive on the acquisition.
The price looked palatable, especially given considerable scope for cost synergies and the strategic rationale is sound. Alongside the acquisition, IOOF is entering into
a 20-year strategic alliance agreement with ANZ that will see the bank distribute IOOF wealth products through its Australian banking network. This will reportedly provide channels to approximately 5.6 million retail customers and 0.5 million corporate, business and SME customers via ANZ channels – advisers and digital.
IOOF Holding’s CEO Chris Kelaher sounded particularly excited about this part of the deal and said “It’s the partnership that is the icing on the cake. You can look at existing profit and what you’re purchasing, but it’s the growth piece into the future that’s exciting.”
Growth through acquisition has long been a pillar of IOOF’s growth strategy and execution has generally been solid.
The latest deal for IOOF is a big mouthful and there are quite a few moving parts, which means that the expected timeline for ANZ separation of its life insurance business from its wealth management operations is approximately 12 months, after which IOOF anticipates another 18-24 months for full integration.
Besides the $975 million price tag, IOOF estimates acquisition and financing costs of $30 million, along with later separation and integration costs of $130 million to be spent over 3 years.
IOOF (ASX:IFL) raised $461 million from an institutional placement and this was supplemented by another $78 million of funds raised from retail investors, which closed in mid-November 2017.
From an EBIT multiple perspective, the price is 9.8 times FY2017A EBIT, falling to 5.5 times including run rate cost synergies. The deal is initially expected to be dilutive to FY2018 cash EPS due to the enlarged share base, with anticipated mid-single digit EPS accretion in FY2019, expected to increase to 15% in the first full year of integration and over 20% thereafter.

Turning to the daily chart, a zone of support is evident between $10.34 and $10.39, should downside pressure mount over the near term. This is made up of the 200-day moving average (green line) and November 2017 low (horizontal blue line) respectively. In order for the short-term technical landscape to improve, a sustained break above the 50-day moving average (red line) of $10.99 is required. If this favourable scenario was to unfold, then momentum would be confirmed to have rotated north, and thus increase the probability of a short-term advance towards overhead resistance sighted at the November 2017 high of $11.46 as represented by the horizontal thin-red line. Furthermore, from a medium-term momentum perspective, this remains in favour of the bull-camp, as backed by the bullish moving average crossover present since May 2017. This occurs when the 50-day moving average (red line) crosses above the 200-day moving average (green line).
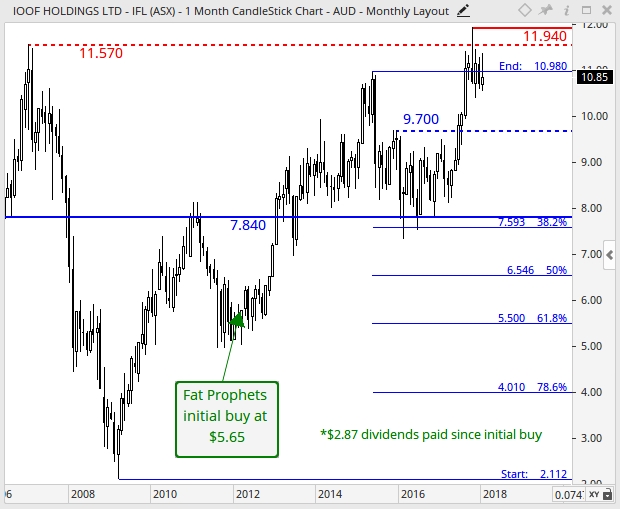
Regarding the monthly chart, and since reaching a high of $10.98 in May 2015, IOOF Holdings’ share price fell into correction-mode, and in the process, touched a low of $7.34 in February 2016. Positively, a zone of support was respected between $7.59 and $7.84. This is made up of the 38.2% Fibonacci retracement and structural support (horizontal solid-blue line) respectively. This has since translated to a stern recovery in price, and we would expect this to continue over the broader horizon, underpinned by the long-term uptrend. Above, the focal point of resistance is sighted at the October 2017 all-time high of $11.94 as marked by the horizontal solid-red line. Therefore, a sustained clearance of this level would strengthen the overall long-term technical landscape.
Summary
FUMAS momentum continued to be positive in 1Q18, getting IOOF off to a decent start for the current fiscal year. We view IOOF Holdings (ASX:IFL) deal to acquire ANZ Bank’s wealth management business as a transformative one that will catapult IOOF up the rankings in the attractive Australian wealth management sector. In addition, the price looks palatable, especially as the deal has considerable scope for cost synergies.
We remain favourably disposed to an investment in IOOF Holdings’ shares based on our view that the company remains well placed to capitalise on the longer-term growth opportunity within its target markets.
Consequently, we continue to recommend IOOF Holdings (ASX:IFL) as a buy for Members with no exposure to the stock.
Disclosures: IOOF Holdings (ASX:IFL) is held in the Fat Prophets Australian Share Income, Concentrated Australian Share and Small/Mid-Cap Models.

