
A bump on the production road
The December quarter was not one of Evolution Mining’s best, with its operations delivering a fall in headline gold production for the quarter. The sale of assets had an impact on the numbers, but some of the company’s operations stepped back over the quarter. Guidance for 2018 was however unchanged which provides confidence in the remainder of the year. Cost outs however remained upbeat for the quarter, while the balance sheet retained its robust characteristic.
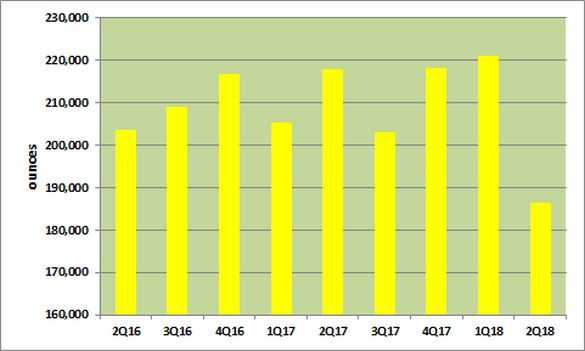
Headline gold production for the December quarter fell by 14% compared to the same quarter for 2016, to 186,489 ounces of gold.
The following chart shows gold production:
Source: Evolution Mining (ASX:EVN)
The fall in headline gold production for the December quarter reflected assets sales and three of the company’s sites reporting lower gold production. The remaining three sites delivered better numbers with Ernest Henry the standout.
The divestment of the Edna May mine in October 2017, removed some 18,588 ounces of gold that was included in the December quarter 2016 result. The company will receive a total consideration of A$90 million, consisting of A$40 million in cash and A$50 million in two future contingency considerations of A$20 million and A$30 million. The company’s rationale in selling Edna May was its high operating cost profile.
Production guidance for 2018 remained unchanged and is forecast to be in the range of 750,000 ounces to 805,000 ounces of gold.
The company did indicate that it expects 2018 production will come in above the mid-point of the range. Gold production for 2017 was a record 844,124 ounces, with the step down in 2018 production due primarily to the Edna May sale.
Silver production, as a by-product, followed gold with the reporting of a fall for the December quarter. Operations delivered 238,429 ounces of silver in the December quarter, which represents a 9.4% fall on the same quarter in 2016. Only the company’s Cowal mine delivered higher silver production for the quarter, while Cracow saw a flat outcome. The sale of the Edna May mine removed 5,362 ounces of silver that was included in the December quarter 2016 result.
For the December quarter, the company produced 6,026 tonnes of by-product copper from its Mt Carlton (585 tonnes) and Ernest Henry (5,441 tonnes) mines.
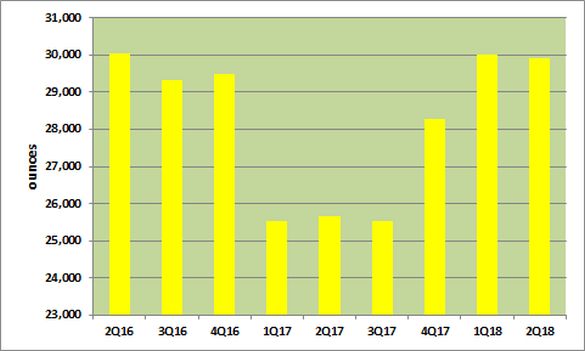
Looking at the key gold performers for the December quarter, the Mt Carlton mine was the standout. The following chart shows quarterly gold production for the Mt Carlton mine:
Source: Evolution Mining (ASX:EVN)
Behind the Mt Carlton result was the mining of higher gold grade ore for the December quarter.
On mine scheduling, the gold grade jumped to 13.22 grams per tonne (g/t) gold from the 3.03g/t gold printed for the same quarter in 2016. A partial offset to the higher gold grade impact was fall in ore processed and gold recoveries. Ore processed through the plant fell 8.6% on the 2016 result, to 106,309 tonnes, while gold recoveries dropping to 91.4% from 91.8%. Lower delivered ore and inefficiencies drove the mill result.
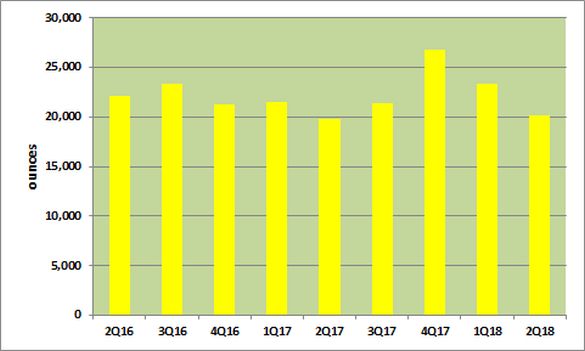
The other contributor with a positive outcome for the reported quarter was the Cracow mine, following the printing of a 2.3% increase in gold production compared to the December quarter 2016, to 20,216 ounces. The following chart shows quarterly gold production for the Cracow mine:
Source: Evolution Mining (ASX:EVN)
Improved milling efficiencies and a better gold grade drove the December quarter result by the Cracow mine. The gold grade jumped to 5.22g/t gold for the reported quarter from 4.72g/t gold reported for the December quarter 2016. Gold recoveries ticked up as well to 94.1% for the December quarter 2017 from 93.8% from a year earlier.
The operational numbers for the Ernest Henry mine look impressive for the December quarter 2017 with the reporting of a 72% increase on the same quarter in 2016, to 24,489 ounces. The Ernst Henry mine was acquired by the company on 1 November 2016, so its December quarter 2016 production number does not reflect a full quarter of reported operations.
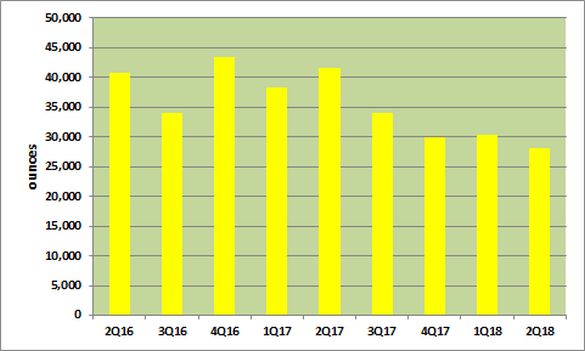
The mines that dragged the overall performance down for the December quarter were Cowal and Mungari. The Mungari deposit was the unfortunate standout following the reporting of a 32% fall on the same quarter in 2016, to 28,156 ounces of gold. The following chart shows quarterly gold production for the Mungari mine:
Source: Evolution Mining (ASX:EVN)
A number of factors drove the Mungari mine’s result with external events including weather and electricity interruptions playing a part. Operationally, infrastructure availability due to maintenance played a role as did a lower mill grade. The culmination of all the above factors saw ore milled for the quarter fall by 6.0% compared to the December quarter 2016, to 405,000 tonnes.
Gold mill grades were also lower 2.3g/t gold for the December quarter 2017 from the 3.22g/t gold reported for the year earlier quarter. Gold recoveries were the one bright spot with the printing of a 94% recovery rate compared to the 93.6% printed from a year earlier.
The other laggard operation was the Mt Rawdon mine with the reporting of a 18% fall in gold production on the December quarter 2016, to 21,418 ounces. The following chart shows quarterly gold production for the Mt Rawdon mine:
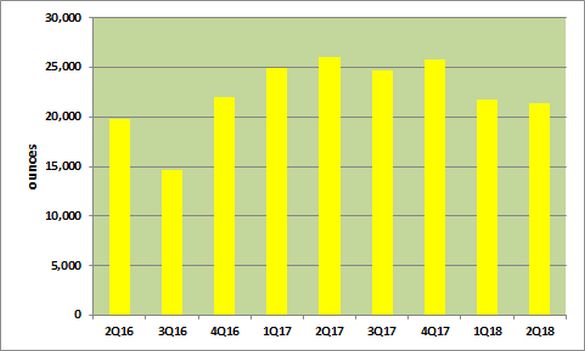
Source: Evolution Mining (ASX:EVN)
Lower milling numbers on weather events and unplanned shutdowns drove the December quarter result. Milled ore fell 6.1% on the December quarter 2016, to 771,000 tonnes. Adding weight to the production slide were the gold grade and gold recoveries. Milled gold grades slipped to 0.98g/t gold from 1.10g/t gold for the December quarter 2016, while gold recoveries slipped to 88.4% from 89% from a year earlier.
Operating costs for the December quarter once again took a good stride forward, and this was despite the fall off in gold production. The December quarter brought with it a significant improvement in C1 cash costs of 23% compared to the December quarter 2016, to A$448 an ounce. All-in sustaining costs (AISC) reported a more modest 13% improvement on the same result from a year earlier, to A$784 an ounce. The following chart shows the company’s quarterly AISC per ounce:
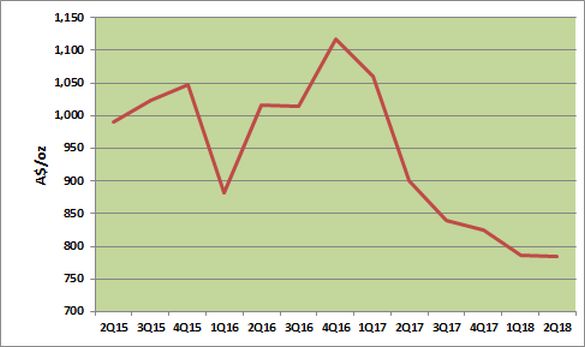
Source: Evolution Mining (ASX:EVN)
This is a very pleasing result and from our view confirms the initiatives implemented by the company to save costs are having the desired impact.
The sale of the Edna May mine which was the company’s highest operating cost mine attests to the company’s endeavours. The Edna May sale had a considerable and positive impact on the company’s overall AISC result for the quarter. A notable performance was put in by the Mt Carlton mine with the reporting of a 18% fall in its AISC on the same quarter in 2016, to A$493 an ounce.
The Ernst Henry mine on better by-product credits for the quarter reported a 450% improvement on the December quarter 2016, to negative A$627 an ounce. The Cracow mine chipped in with a more modest 3.6% improvement on its year earlier result, to A$1,237 an ounce. The company will, over the remainder of 2018, continue to investigate new cost saving initiatives across all of its operations.
AISC guidance for 2018 remained unchanged and is forecast to be in the range of A$820 an ounce to A$870 an ounce. The company did however indicate that it expects AISC to fall toward the bottom end of the forecast range or below it.
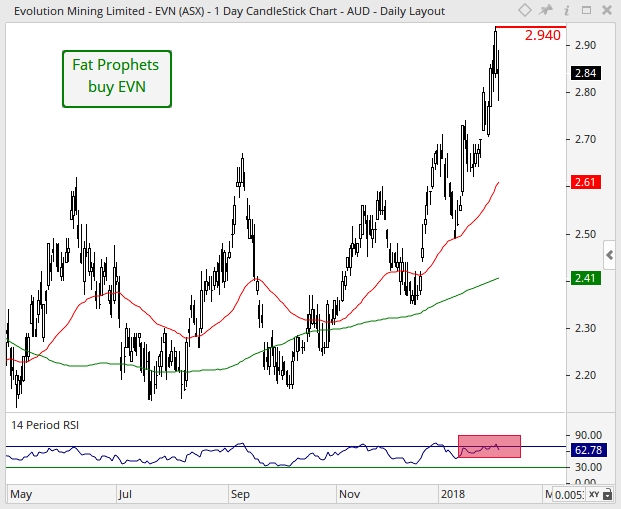
Turning to the daily chart, and as a result of the firm increase in share price this has led the RSI to rise into overbought territory (exhaustion of short-term upward momentum). Hence, should the bears maintain downward pressure over the near-term, a temporary pullback in price could follow. Positively, should this occur, we would view this short-term pause as corrective, as the underlying broader uptrend remains firmly intact. In the grand scheme of things, the bullish moving average crossover (where the 50-day moving average red line crosses above the 200-day moving average green line) present is indicative of medium-term momentum to favour the upside. Therefore, an eventual upward rotation towards resistance located at the February intra-month high of $2.94 as denoted by the horizontal red line is deemed to be the likely path, moving forward.
On pricing, the company reported a 2.3% increase in the average realised gold price on the same quarter from a year earlier, to A$1,640 an ounce.
The average silver price realised over the same period as gold flat lined at A$22 an ounce. The realised copper price was the big mover with an impressive 27% rise on the December quarter 2016, to A$9,595 a tonne.
To partially protect operating revenue and margins, the company held at 31 December 2017 362,500 ounce of gold hedged at an average price of A$1,670 an ounce. With the gold price in Australian Dollars trading around A$1,672 an ounce; based on the average price for the total hedge, the position is ‘in-the-money’, albeit by only a few dollars. We consider the position as prudent in the current pricing environment.
The company has continued to improve the structure of its balance sheet, which saw net bank debt fall to A$231.5 million from A$588.5 million from a year earlier. The company held cash of A$163.5 million at 31 December 2017 compared to only A$14.3 million from a year earlier. We have no concerns over the structure of the balance sheet. Evolution (ASX:EVN) will provide greater clarity around its financial position with the release of its interim result for 2018 on 15 February 2018.
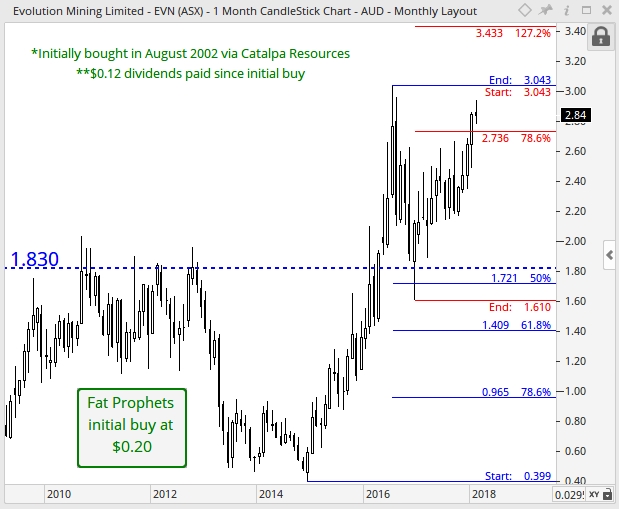
With reference to the monthly chart, a cluster of support was respected between $1.72 and $1.83. This is made up of the 50% Fibonacci retracement (blue set of retracements) and the October 2010, September 2011 and October 2012 resistance (horizontal dashed-blue line) respectively. In addition, a ‘bullish doji’ candlestick pattern formed as of the close of trading in December 2016, which is a sign of positive sentiment to arise over the medium-term. Positively, from a broader perspective, prices have closed (on a monthly-basis) above the 78.6% Fibonacci retracement of $2.74 (red set of retracements) in January. This is a bullish development, as an activation of the next broader term upside target of $3.43 is triggered (127.2% Fibonacci extension). Furthermore, long-term momentum is favoured to the upside, as evident from the series of higher lows (i.e. troughs) and higher highs (i.e. peaks), which are characteristics of a dominant broader term uptrend in place.
We believe Evolution (ASX:EVN) has a suite of quality gold assets with brownfield expansion capacity, and also a balance sheet to act as a springboard to deliver. Management’s efforts to reduce costs and maintain a squeaky clean balance sheet are exemplified in the December quarter announcement.
Markets globally would appear to be getting more concerned about rising inflation, and with it rising bond yields. We have held the view for some that increasing inflationary pressures would eventuate and this would drive gold prices higher. We maintain this view, and Evolution has strong leverage to this thematic. The company should also benefit if higher US$ gold prices are accompanied by a pullback in the A$.
Consequently, Evolution Mining (ASX:EVN) is recommended as a high conviction buy for Members with no exposure to the stock.
Disclosure: Evolution Mining (ASX:EVN) is held within the Fat Prophets Concentrated Australian Share, Mining & Resources and Small & Mid Cap Portfolios.

