
Showing resilience
In what has been a relatively quiet period for BWP Trust (ASX:BWP) over the past year, the stock has drifted sideways. Nonetheless, the Trust is well managed and judging by the interim results has once again managed to eke some minor gains in several key metrics and defend its dividend profile despite headwinds.
Transaction news flow from BWP Trust has been relatively quiet since our last review, so the focus of our report today is the recently reported interim results.
1H18 key highlights
As we’ve noted several times, BWP Trust (ASX:BWP) has consistently generated modest growth in distributable profit as driven by sequential increase in rental income through acquisitions, debt management, stable management expense, occupancy and gearing ratios. Ultimately, this lends toward gradual improvement in profit margins while its defensive nature ensures stability.
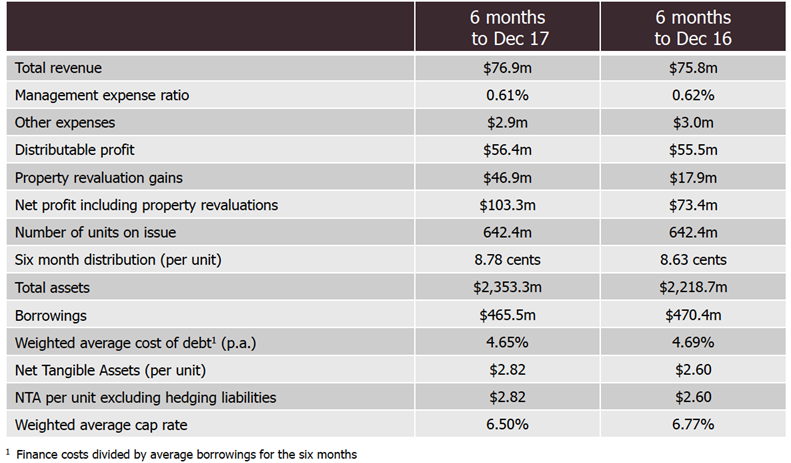
For the six months ended 31 December 2017, ‘distributable’ profit eked out a 1.7% gain (excluding revaluations) due to higher property revenue from rental increases and lower borrowing costs. The distribution per unit also increased at the same pace to 8.78 cents per unit. The distribution is set to be paid on 23 February 2018 to unitholders that were on the register on 29 December 2017. The group expects to be able to maintain distribution growth at 1.7% in the second half of the financial year.
Source: BWP Trust (ASX:BWP)
Total revenue ticked up 1.6% year-on-year to $76.9 million. This was primarily due to rental growth from the existing property portfolio. Fifty-three of the Trust properties leases had annual fixed or CPI reviews during the period, with the weighted average increase in annual rent coming in at 2.4% in the 12 months to the end of 2017.
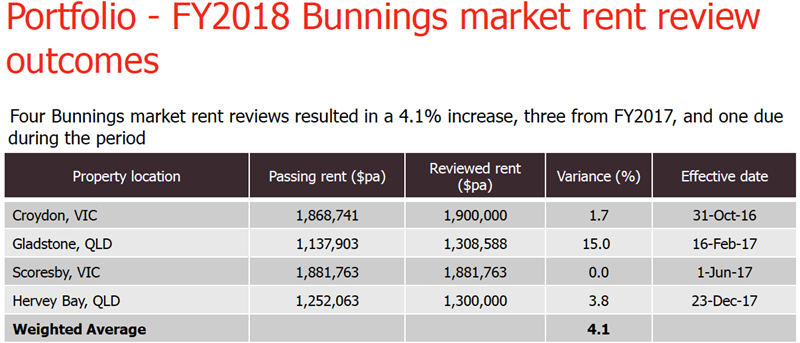
There were 79 properties in the portfolio during the period and at the end of 2017 and the portfolio was 99.2% leased. Approximately 61% of the Trust’s rental income is subject to CPI adjustments and 39% subject to fixed annual adjustments, other than in years in which respective properties are due for a market rent review. Four Bunning market rent reviews (MRRs) resulted in a 4.1% increase. While three were begun in FY17 the outcomes were determined in 1H18.
Source: BWP Trust (ASX:BWP)
Including accounting gains on investment properties, the trust’s property portfolio increased in value by $46.9 million to $2,353.3 million. Rental growth and capitalisation rate compression equally contributed to the net fair value gain. The weighted average capitalisation rate fell from 6.77% in 1H17 to 6.50% in 1H18. Net tangible assets per unit of $2.82 represented an increase of 8.5% from the prior corresponding period of FY17.
Including the accounting gains in fair value of investment properties, net profit increased roughly 41% from a year ago to $103.3 million.
Finance costs of $11.2 million were marginally lower (-1.0%) than in the prior corresponding period of fiscal 2017, due to slightly lower borrowing costs and a lower weighted average cost of debt.
Borrowings at the end of December 2017 were $465.5 million compared to $470.4 million a year earlier, while the weighted average cost of debt dipped from 4.69% in 1H17 to 4.65% in 1H18. Interest cover ticked up from 6.1 times a year ago to 6.2 times at the end of 2017. Gearing was a modest 19.8%, down from 21.2% a year earlier.
In terms of major changes to the property portfolio, the six months to the end of 2017 was a quiet period. The group did divest a property vacated by Bunnings at Dandenong in Victoria to an undisclosed third party for $16.4 million in November 2017. Its June 2017 fair value was $13.3 million, so the outcome was a decent one.
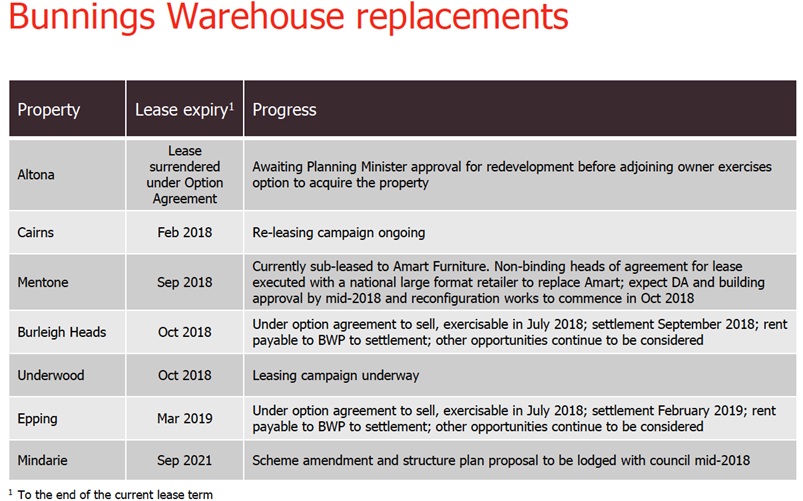
Looking at work in progress for Bunnings Warehouse replacements and the group provided the following table showing an expected timeline and current strategy.
Source: BWP Trust (ASX:BWP)
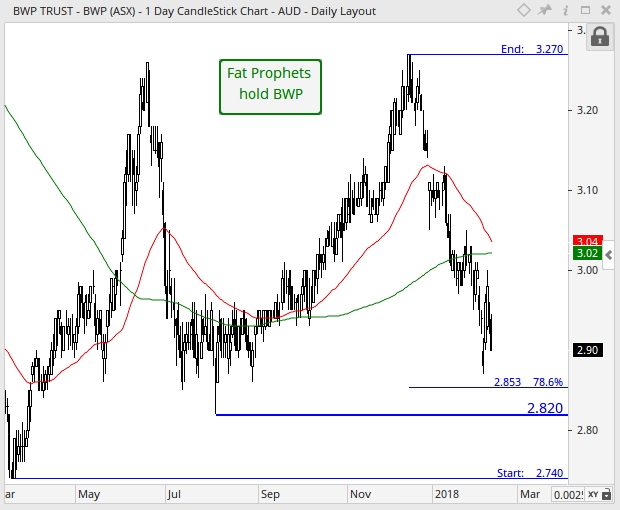
Turning to the technical picture and on the daily chart, a zone of downside support is indicated between $2.82 and $2.85, if the bears were to dominant over the near term. This is made up of the August 2017 low (horizontal solid-blue line) and the 78.6% Fibonacci retracement respectively. It is important that the bulls defend this price range, and a consolidation unfolds over the medium-term. Should this occur, then this would encourage a period of price-stabilisation to evolve, and thus ease the recent weakness in share price. For the short-term technical outlook to improve though, a decisive break above the 50-day moving average (red line) of $3.04 is required. Should this positive development evolve, then momentum would once again shift in favour of the bull-camp.
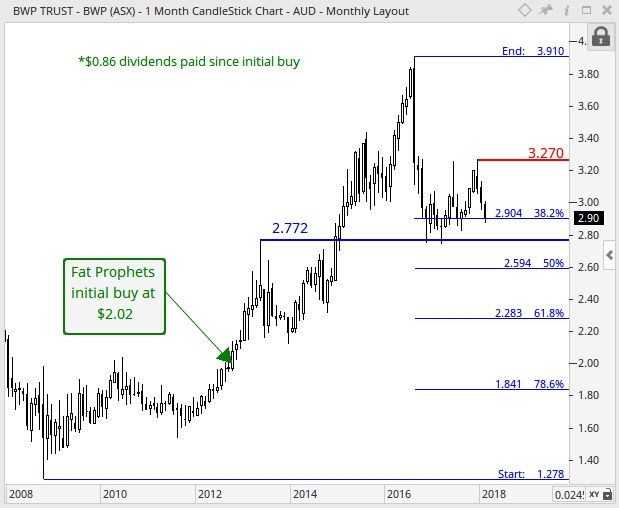
Regarding the monthly chart, an all-time high of $3.91 was reached in August 2016. Since then, a healthy correction in the share price has ensued. At present, a zone of support is situated between $2.77 and $2.90 which is made up of the May 2013 resistance level (horizontal solid-blue line) and the 38.2% Fibonacci retracement respectively. Should upward momentum rise, then overhead resistance is evident at the December 2017 high of $3.27 as marked by the horizontal red line. A sustained break above this level would likely result in a resumption of the long-term uptrend.
Summary
In 1H18, BWP Trust (ASX:BWP) achieved a decent performance in several key metrics, including eking out a small gain in the distribution per unit and managing borrowing costs well. The group still has substantial work to do to reposition the portfolio in the wake of the Bunnings Warehouse exit, but its assets are well located and of a high quality.
On the valuation front, the stock is trading at around 16.4 times the FY18 earnings forecast and a projected price to book value multiple of just 1.2 times, while offering a forecast FY18 yield of 6.1%. We are therefore content to hold BWP Trust at this juncture.
BWP Trust (ASX:BWP) will remain held in the Fat Prophets Portfolio.
Disclosure: BWP Trust (ASX:BWP) is held within the Fat Prophets Australian Share Income and Australian Small & Mid Cap Models.

