
Packing Earnings Growth
Orora Limited (ASX:ORA) shares have continued to deliver solid returns for shareholders over the past year, extending a strong record of share price appreciation since its demerger from Amcor. Although there are some challenges, the fundamentals continue to be relatively attractive in our view and the business is well managed. There is scope for margin improvements at the North America businesses and the company has a solid balance sheet providing the financial flexibility to supplement organic growth with acquisitions.
Orora’s ‘blueprint’ for adding shareholder value:

Source: Orora (ASX:ORA)
Innovation Expo & Business Update
In May 2018 Orora (ASX:ORA) provided a look at its innovation strategy and a brief business update. Orora defines innovation as “the implementation of new ideas that create value for our customers, and our company”. Key goals are to stimulate growth, increase productivity, reduce cost and deliver better products and services. Orora’s approach is focused on machines & technology, its workplace (people & culture) and collaborating with customers.
Management highlighted the new EFI Nozumi C18000 single-pass LED inkjet corrugated packaging presses as examples of using cutting edge technology.
Nigel Garrard, Orora’s Managing Director and CEO said earlier this year that, “The new EFI Nozomi C18000 digital printers are genuine game changers for our corrugated packaging customers, delivering magazine quality imagery directly onto corrugated board at ultra-high-speed,” and went on, “We are the first company to purchase and install the Nozomi printer in Australia and one of the first to use this print technology in North America. Our investment in these state-of-the-art printers demonstrates Orora’s commitment to keeping our business and customers at the forefront of the market.”

Source: Orora (ASX:ORA)
Orora recently upped its Global Innovation Initiative investment budget by $30 million to $75 million, with $45 million of cumulative investment through to 1H18.

Source: Orora (ASX:ORA)
Discussing how the company is developing employees and corporate culture, management highlighted internal crowd sourcing being used to ‘turn good ideas into great ideas’, ‘innovation ambassadors’ and industry ‘4.0 cadets’.
In an update on how the North America business has fared to date in the second half and its outlook, Orora said that conditions in North America were like that experienced in the first six months and therefore challenging for growth. Tax reforms in the US are expected to be positive over the medium term.
In the Orora Packaging Solutions (OPS) business, the company said that following the success of its Australasian Asset Refresh program, planning is already underway for applying a similar approach with OPS. The potential investment size of the program was pinned at around US$50 million with the funds to be deployed in FY19 and FY20.
Orora (ASX:ORA) has spent around $70 million in Australia and New Zealand to refresh and upgrade fibre packaging assets over the past few years and has another $30 million committed to the purpose.
A new enterprise software system (SAP) continued to be rolled out across the remaining sites in the OPS business and is on track to be complete by August 2018. The benefits from the rollout of this software system are expected to begin flowing from CY19. The company is now actively looking at more merger and acquisition opportunities for OPS, particularly in the distribution and manufacturing areas.
Management reported that Orora Visual results have continued to improve and that integration progress was steady. There have been some management changes with a new CEO and COO (chief operating officer) assuming the roles from March 2018. Orora said that the “value proposition is resonating well with existing and new customers with several recent wins and an encouraging pipeline.”
There are some weak spots, with 2H18 results to be impacted by a further doubtful debt provision of US$1.5 million, taking the total impact for the fiscal year to US$2.5 million. Management are estimating that if a major customer doesn’t emerge from liquidation the impact on sales and PBIT (profit before interest and tax) will be approximately US$8 million and US$1.5-2.0 million respectively.
Regarding its Australian business environment, the company said moves by China has hit the recycled papers market hard, with a lack of alternative external markets to consume the material in the short term. China’s so-called “National Sword” policy has reduced the import of recycled materials, which is intended to transition the country to a more domestic driven industry and cut down on the waste imported along with the recycled materials. Lower contamination levels for imports into China are in place and being enforced. Additional sorting methods are needed to source new uses for materials.
The value of mixed RCP (recycled paper) has fallen sharply and is impacting pricing for other grades as well. China’s moves have generated considerable volatility in the OCC (old corrugated containers) market, so during the first half of 2018 Orora locked in supply and pricing for around 80% of its OCC requirements.

Source: Orora (ASX:ORA) / average of various RISI OCC indices
Separately the company inked a new renewable energy agreement effective from May for electricity requirements in NSW and VIC. Combined with existing power purchase agreements (PPA) for renewable energy in South Australia, around 80% of Orora’s domestic electricity requirements are generated from renewable sources. The new PPA is at a fixed price and Orora said its previously forecast annual energy headwind of A$12-16 million will be reduced to approximately A$7 million as it significantly reduces the company’s exposure to volatile electricity prices in NSW and VIC.
Orora did not provide hard numbers for its guidance and at the group level management said it has maintained its expectation for higher earnings in constant currencies for FY18, driven by organic growth and investment in innovation and growth. The outlook came with the usual caveat that it was “subject to global economic conditions.”
We were content with Orora’s first half results when they reported them back in February and the market was as well, bidding the shares up 4% after their release.
Revenue increased 6.2% year-on-year to $2,097.8 million, driven by several factors including 3.0% growth in OPS (Orora Packaging Solutions) revenues.
Group EBITDA came in at $227.3 million, marking a 10.7% increase, while group EBIT was up 10.5% to $165.3 million. On a constant currency basis EBIT increased 11.9%. The improvement in EBIT was attributable to Fibre Packaging revenue and margin gains in targeted segments, additional production volume at B9, better efficiencies across the Australasian business, ongoing improvements at OPS and contributions from the recently completed acquisitions in Orora Visual. These positive factors more than offset some higher input costs at B9, adverse weather events at OPS and currency movements.

Source: Orora (ASX:ORA)
Statutory net profit after tax (NPAT) was $103.8 million, while NPAT before significant items was $105.7 million, representing a 14.8% increase from a year earlier. That translated into earnings per share, excluding significant items of 8.8 cents, up 14.7%. The significant item in the accounts was a $1.9 million net profit on the sale of Fibre Packaging’s Smithfield site, offset by costs related to the restructure of Fibre Packaging in NSW and potential decommissioning costs associated with the Petrie Mill site.
The interim ordinary dividend of 6.0 cents per share was a 20% increase from a year ago and was 30% franked. That represented a pay-out ratio of approximately 69%, at the high end of the company’s 60%-70% target range.

Turning to the daily chart, overhead resistance situated at the November intra-month high of $3.43 as shown by the horizontal red line, has been surpassed. Medium-term momentum remains in favour of the bulls, as backed by the bullish moving average crossover present since August. This is when the 50-day moving average (red line) crosses above the 200-day moving average (green line).
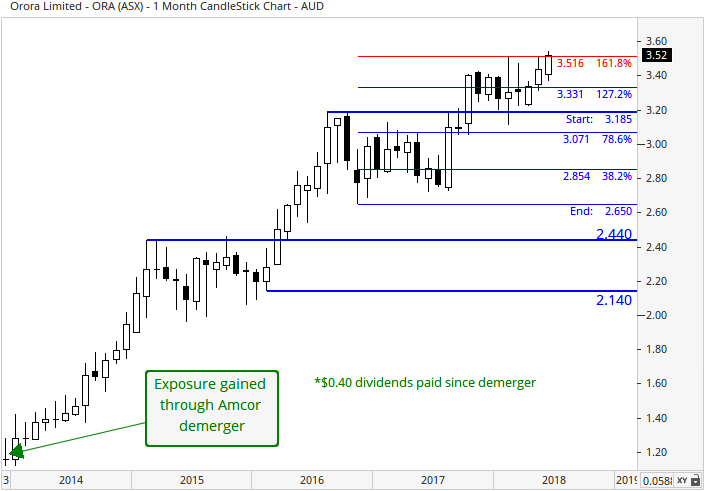
With reference to the monthly chart, prices have closed (on a monthly-basis) above the 78.6% Fibonacci retracement of $3.07 (red set of retracements). This is a positive event and activated two additional upside targets. The initial target of $3.33 being the 127.2% Fibonacci extension has since been achieved, which now leaves the 161.8% Fibonacci extension of $3.52 as the next focal point of resistance. This is currently being tested. Overall, the long-term uptrend remains firmly intact.
Summary
We continue to view Orora as well placed to capitalise on incremental improvements in general economic activity. Orora has generally delivered solid results even amid subdued market conditions through a combination of efficiency gains, business improvement initiatives and acquisitions. Looking ahead, we expect North America and Orora Visual to be key earnings drivers, given the scope for margin improvement, at least over the near-to-medium-term.
Orora (ASX:ORA) shares trade on approximately 20.5 times FY18 earnings estimates, falling to 19 times the following year, with a partially franked forecast dividend yield of 3.5% increasing to 3.7% over the same time frame.
Orora (ASX:ORA) will remain held in the Fat Prophets portfolio. We recommend the stock as a Buy around current prices for Members without exposure.
Disclosure: Orora (ASX:ORA) is held with the Fat Prophets Concentrated Australasian Share, and Small & Mid-Cap Models.

