
Halfway There But Already Ahead
Australia’s Fastest growing investment and superannuation platform provider, HUB24, (ASX:HUB) recently disclosed its first half performance, reporting robust growth across the board. It also shows that the acquisition in early 2017 has proved to be accretive having added to the user counts. We like that the company continues to display strong operational momentum, as supported by continued product innovation while enjoying strong operating leverage. As such we maintain our HOLD rating on the stock.
Recap and What’s New?
In our last coverage back in October (FAT-AUS-846) we highlighted the positive trends the company was making with the Funds Under Administration (FUA) surpassing the $6 billion mark with net inflows of $535 million – the company’s second highest result since 4Q17.
Since then, HUB24 (ASX:HUB) has provided an update at the end of January 2018 showing that record superseded with the latest FUA net inflows count of $554 million up 68.9% year-on-year. This puts FUA very near the $7 billion mark at $6.899 billion and the highest on record. Going forward, we believe the company is well placed to continue its strong momentum given the recent additions to licensees and advisors (discussed below) as well as improvements in the platform following the Agility Applications acquisition in early 2017.
That aside, the most salient development was the company’s interim announcement covering the entire performance of the first half period (ending 31 December 2017). And without further ado, the results:
1H18 Results Review
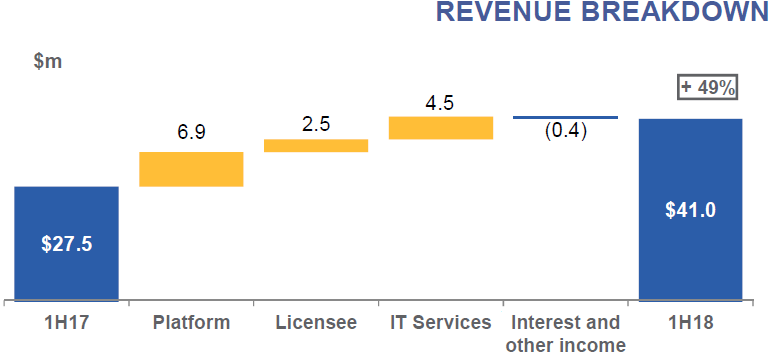
Starting from the top and following momentum indicated in the trading updates, HUB24’s revenues surged 49% year-on-year to $41.01 million with most of the growth coming from the robust inflows into the company’s platform business. These are all summarised in the graphic below.
Aside from the platform business (which will be discussed in detail below), the second most impactful in terms of revenue growth as the IT services unit, driven by the recent January 2017 acquisition of Agility Applications, and generating $4.49 million in revenues. Note that there is no year-on-year comparison as this was not part of the business model in the previous interim period.
Going forward, we believe that revenues from this business will mirror the pace of advisors and brokers’ growth which will likely accelerate once AgilityConnect has fully integrated into the HUB24 (ASX:HUB) platform. Just based on the transition initial transition alone, they have already brought in 200 more users to the platform, bringing the total count to 2,553 users.
This was then followed by Licensee fees of $17.33 million, up 16.9% year-on-year based on 110 active licensees. This is set to increase even further as the 1H18 period saw the addition of 22 new licensees with current Funds Under Administration (FUA) at circa $4.4 billion.
Source: 26 February 2018 Company Presentation
As we have noted numerous times in our coverage of the investment platform sector, we believe that this type of business model enjoys a high degree of operating leverage – this is when a company has high fixed costs relative to variable costs, implying that a large proportion of sales growth drops through to earnings as the cost to produce revenues remains relatively unchanged.
This is highly relevant given that Australia is the fourth largest retirement pool with over $2.61 trillion in the superannuation system and still growing at a fast-double-digit clip, up 10.1% year-on-year as at December 2017.
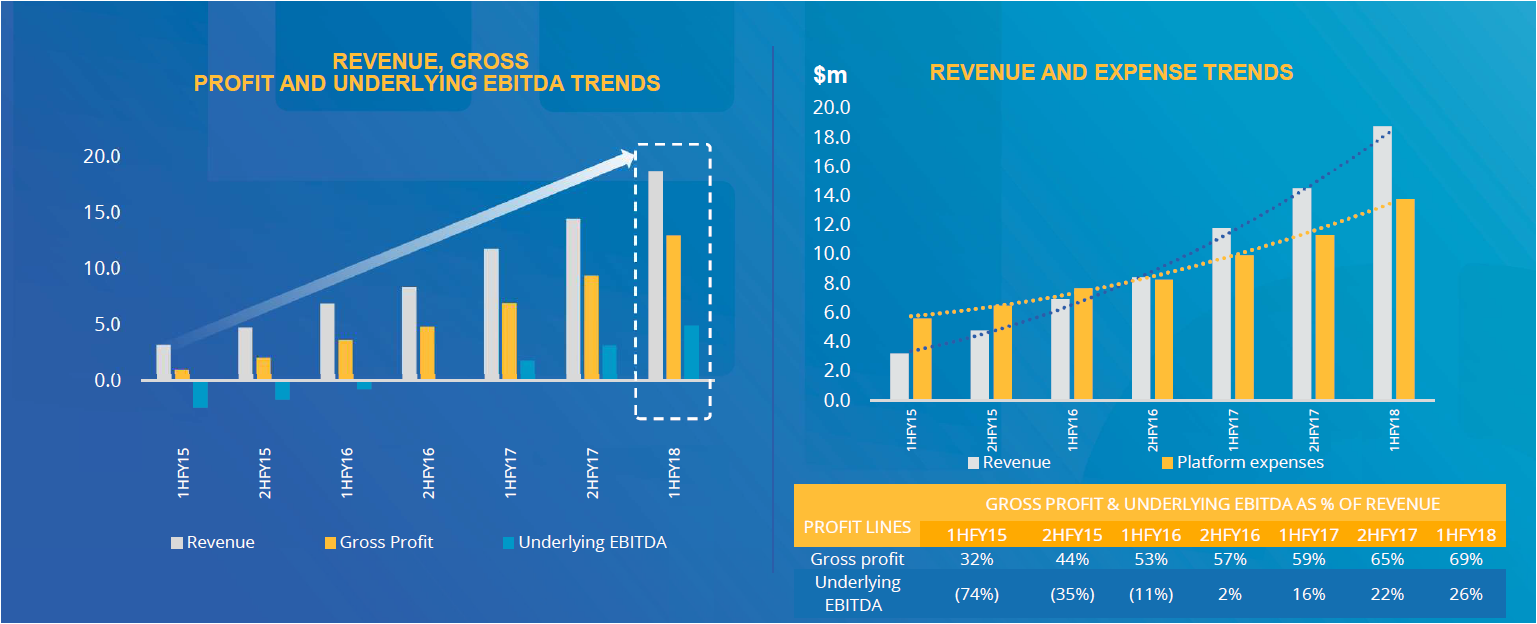
No surprise then that the Platform business also continues to reach new highs with this interim result, and revenues up 58.7% year-on-year to $18.77 million. The growth trends in this segment is summarised below. FUA as at the end of the period has reached $6.9 billion which was up 66% year-on-year with accelerating net inflows reported to be up 57% year-on-year to $1.09 billion.
Source: 26 February 2018 Company Presentation
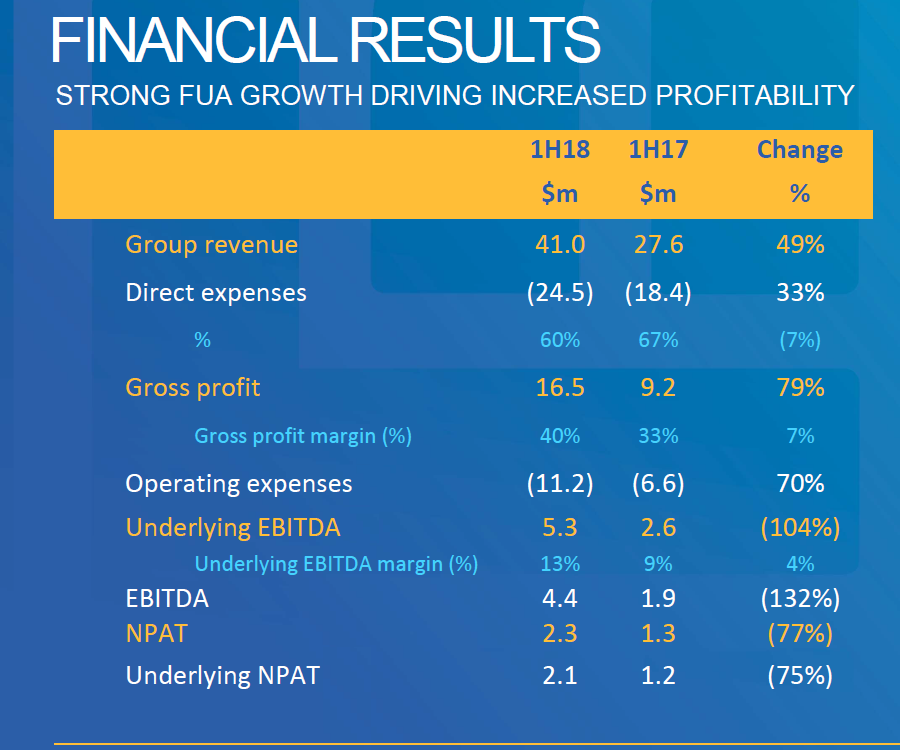
Given the strong performance across all business segments, gross profits almost doubled (+94% yoy) to $16.05 million with the largest contributor being the platform business at $13 million or 81% of the total. As we’ve mentioned above, the business enjoys a high degree of operating leverage with FUA growth over the years leading to higher and higher levels of gross profit from a gross profit margin of 32% in 1H15 to 69% as at 1H18.
Operating expenses were also substantially higher, up 70% year-on-year to $11.15 million, though this increase was the side effect of management’s growth push. Some of notable causes for operating expense growth were as follows: (i) the Agility Applications acquisition (+$1.4 million), (ii) “growth investment resources” at $3.5 million (+$1.1 million yoy) which are mainly sales and marketing personnel and (iii) an undisclosed figure relating to hiring a new development team to combine Agility and the HUB24 platform among other tech developments.

Source: 26 February 2018 Company Presentation
The graphic above summarises the EBITDA breakdown with the platform business bringing in most of the growth as well. Though admittedly, the Licensee and IT services don’t’ provide a large part in the bottom-line, they do provide other substantial benefits which come in the form of cross-selling services and more importantly building a network effect and raising switching costs. Underlying EBITDA was up 185.4% year-on-year to $4.9 million (difference from image due to rounding errors).
Also, we like that the company doesn’t carry any debt, leading to net interest income of $194,387, with growth funded from operating cash flows, this time up over 3 times last year’s $1.49 million figure to $4.599 million. Given that, the cash position has now accumulated to $13.62 million, up 25.7% year-on-year.
All in all, HUB24 (ASX:HUB) has reported its 2nd half year of profitability with statutory net profit after tax (NPAT) up 72.6% year-on-year to $2.29 million and underlying NPAT of $2.13 million, up 75.1% year-on-year. Basic EPS is ahead 56.6% year-on-year to A3.90 cents while Diluted EPS is up 60% year-on-year to A3.76 cents.
Source: 26 February 2018 Company Presentation
Going forward, the outlook for the company remains increasingly positive with a minor trading update from management indicating that FUA has now reached over $7.2 billion while the adviser count has reached over 1,000, up 41% year-on-year.
Management notes that the company is steadily gaining market share as the platform business captured 13.5% of net inflows. This is over a third of net inflows from other net technology platforms, definitely a positive sign in our view.
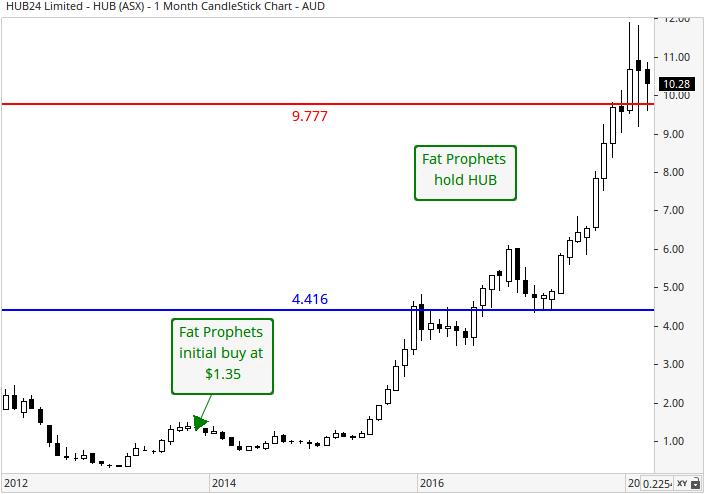
Turning to the charts and with reference to the monthly chart, the long-term uptrend remains firmly intact. Resistance has recently breached at the July 2007 all-time high of $9.78 (horizontal solid-red line). We will be looking for this level to act as a new layer of support.
Summary
HUB24 (ASX:HUB) is off to a strong start in the first half of financial year 2018, reporting massive growth in both the top and bottom-lines. We like that the company continues to win favour with clients having reported more growth in licenses and advisors while the Agility acquisition will ultimately lead to greater network effects and higher switching costs.
With the momentum in FUA growth remaining strong and a high degree of operating leverage, it is no surprise that this is resonating in HUB24’s financials, and this was evident at the full year results announced in August. The year ended 30 June 2017 marked the company’s maiden profit and at the current pace indicates that the company is well on its way to a second year of profit.
With the company continuing to display strong operational momentum, supported by continued product innovation, investment in technology and prudent acquisitions, while enjoying strong operating leverage, we believe earnings are set to expand at a rapid pace over the longer term, thereby driving shareholder value.
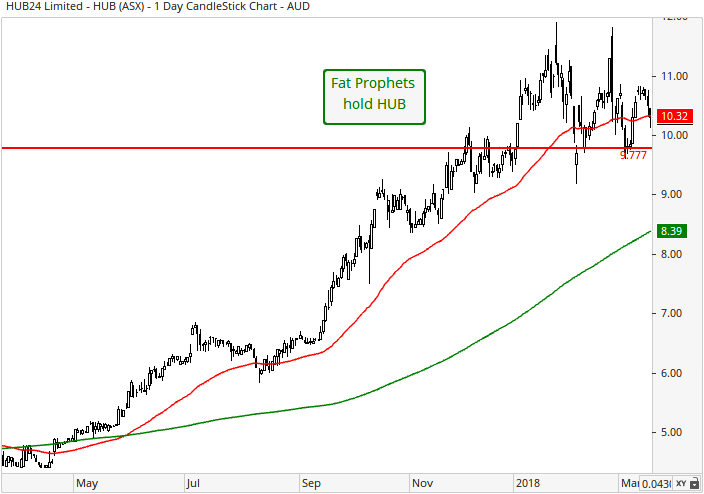
HUB24 (ASX:HUB) is trading on an earnings multiple of almost 75.6 times for FY18, falling to 39.6 times for FY19. These are fairly full multiples, even allowing for the operating leverage present. Having already take some profits, we are however comfortable with maintaining a hold recommendation for longer term upside.
Accordingly, HUB24 (ASX:HUB) will remain firmly held in the Fat Prophets Portfolio.
As a note to Members we retain buys on Praemium and OneVue which also operate in the platform space.
Disclosure: HUB24 (ASX:HUB) is held within the Fat Prophets Small/Mid-Cap Model.

