
Mt Rawdon hits its straps
Evolution Mining (ASX:EVN) has reported a soft March quarter production outcome, with an asset sale impacting the numbers. Operations across three of the company’s sites reported lower production numbers for the quarter, while three others delivered higher outcomes, with Mt Rawdon being the standout. Positively, the key takeaway for the quarter lay in the significant fall in operating costs. Despite the fall in the March quarter production of gold, guidance for 2018 was boosted. Moreover, a snapshot of the balance sheet reveals a further improvement in quality, on a higher gold price.
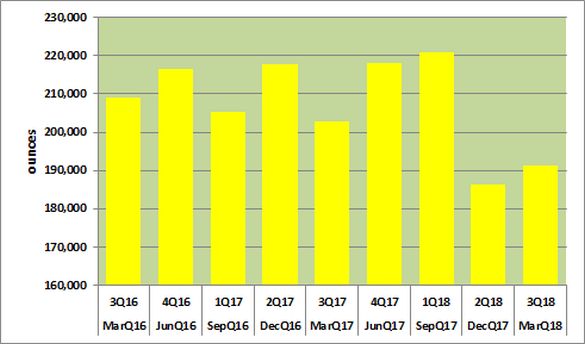
Gold production for the March quarter 2018 fell by 5.6% compared to the same quarter in 2017, to 191,474 ounces of gold.
The following chart shows quarterly gold production:
Source: Evolution Mining (ASX:EVN)
The primary driver of the result was the removal of gold production for the Edna May mine, due to that mines’ sale in the December quarter 2017. On a like-for-like basis (removing the Edna May numbers from the March quarter 2017 outcome) gold production for the reported quarter fell by a mere half of one percent. The Edna May mine added 10,480 ounces of gold to the year earlier result.
Despite the fall in gold production for the March quarter, the company remains confidant in its operations over the remainder of 2018, as it upgraded production guidance for the year. Gold production for 2018 has been upgraded to be in the range of 790,000 to 805,000 ounces of gold, from the previous 750,000 to 805,000 ounces. In 2017, the company produced a record 844,124 ounces of gold. The step-down in production in 2018 is a result of the Edna May mine.
As a by-product, the company produced 236,274 ounces of silver for the reported quarter, representing a fall of 11.3% on the corresponding quarter in 2017. The sale of Edna May removed 3,824 ounces of silver; on a like-for-like basis overall silver production fell by 10.0%. The Mt Carlton mine and the company’s largest silver producer, on a focus to mine gold, delivered a fall of 14.8% in silver production compared to the same quarter in 2017, to 109,618 ounces. No production guidance is provided for silver.
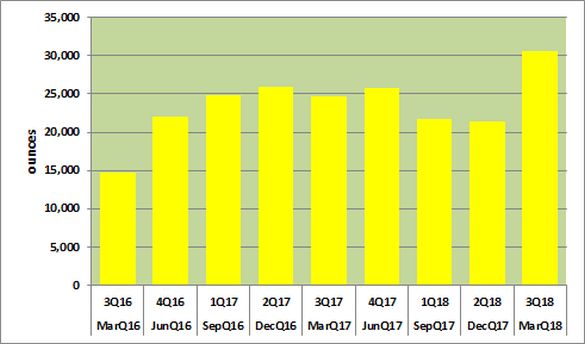
First to the ups, and driving the March quarter 2018 result was the Mt Rawdon mine, following the reporting of higher gold production. The following chart shows quarterly gold production for Mt Rawdon:
Source: Evolution Mining (ASX:EVN)
The standout mine for the quarter was the Mt Rawdon mine following the delivery of a record 30,625 ounces of gold, which represents a 24.2% increase on the same quarter in 2017.
The mine delivered 1.4 million tonnes of ore at a grade of 1.10 grams per tonne (g/t) gold. Ore delivered rose by 17.1% on the same quarter from a year earlier, while the gold grade improved by 0.10gt. Mine availability and efficiencies drove the result for Mt Rawdon. Milling throughput of ore fell half of one percent on the same quarter one year earlier, to 796,000 tonnes. The processing grade and recoveries more than offset the lower throughput, with the grade up 1.34g/t from 1.09g/t from a year earlier and gold recoveries improved to 89.3% from 87.8%.
Guidance for Mt Rawdon in 2018 remained unchanged in the range of 100,000 to 110,000 ounces of gold.
The other mines to report better production numbers for the March quarter were the Mt Carlton and Ernest Henry mines.
Mt Carlton produced 25,839 ounces of gold and Ernst Henry 22,839 ounces. Compared to the production results from a year earlier, Mt Carlton reported a 1.2% increase and Ernest Henry a 2.7% increase.
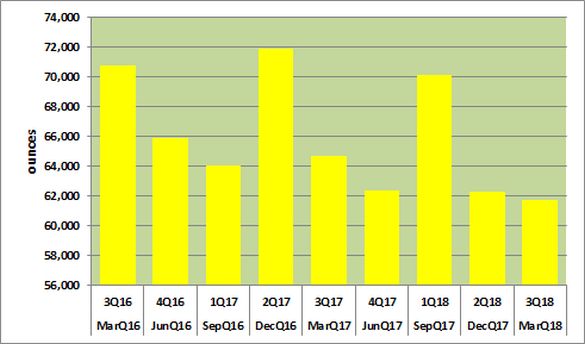
On the downs, the key Cowal mine reported a fall in gold production of 4.6% compared to the March quarter 2017, to 61,749 ounces. The following chart shows quarterly gold production for the Cowal mine:
Source: Evolution Mining (ASX:EVN)
Cowal operations delivered lower ore tonnage and a mined grade on a lower mine scheduling. Tonnage mined fell by 33% compared to the same quarter in 2017, to 1.6 million tonnes of ore with the grade falling to 1.18g/t gold from 1.20g/t gold from a year earlier. Milling ore throughput rose while the milling grade and gold recoveries slipped lower. Ore throughput rose by 13.2% on the 2017 result, with gold recoveries down 50 basis points to 82.0% and the gold grade down 0.21g/t to 1.17g/t gold.
The Cowal mine is expected to deliver 2018 production toward the top end of guidance in the range of 235,000 to 245,000 ounces which remained unchanged.
The other mines to report production falls were the Mungari and Cracow mines, with falls of 12.1% and 3.7% respectively on their 2017 march quarter results, to 29,820 and 20,591 ounces of gold.
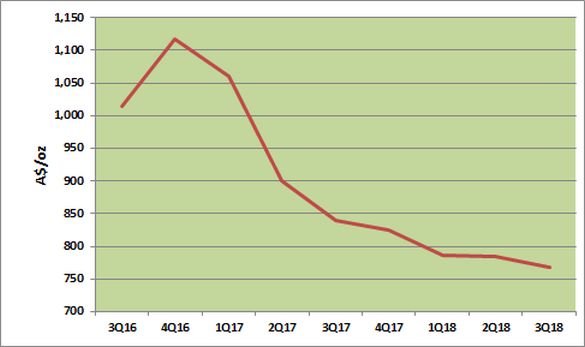
Operating costs were the key takeaway from the March quarter result, following the reporting of a significant improvement. The following chart shows the company’s All-in sustaining (AISC) cost per ounce:
Source: Evolution Mining (ASX:EVN)
Costs continue to take good strides forward, without the backing of better gold production numbers for the quarter. The March quarter brought with it a good improvement in C1 cash costs of 10.5% compared to the March quarter 2017, to A$536 an ounce. AISC also reported a more modest improvement of 8.6% on the year earlier result, to a record A$768 an ounce. The recent trend in AISC is a feature that the company continues to prioritise, with the sale of Edna May, its highest AISC operation, exemplifying the company’s approach to optimising operating costs.
AISC guidance for 2018 is forecast to be in the range of A$780 to A$820 an ounce.
In 2017, AISC came in at A$905 an ounce, with the major step down in 2018 being a welcomed outcome.
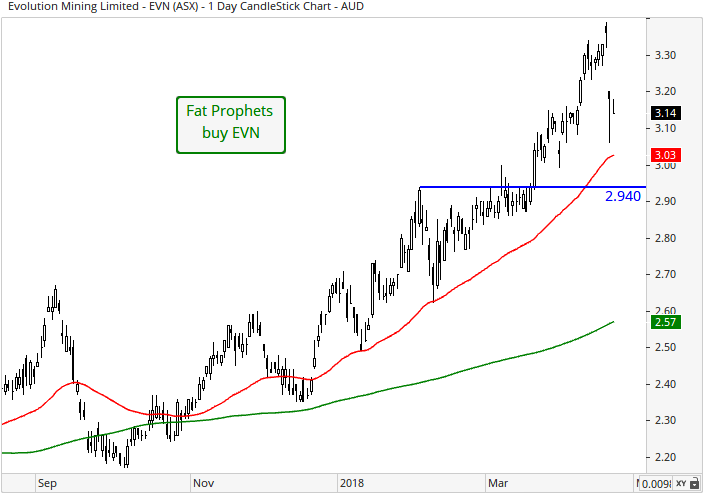
To partially protect operating revenue and margins, the company held at 31 March 2018 a 312,500 ounce gold hedging position at an average price of A$1,684 an ounce. At the time of writing, the Australian gold price was trading around A$1,739 an ounce. The company’s position is currently “out-of-the-money” and is therefore not profitable. We consider the position as prudent in the current pricing environment for gold.
The company reported a rise in the average realised gold price of 4.0% compared to the same figure from a year earlier, to A$1,664 an ounce. We retain a positive outlook on the gold price for the year ending 31 December 2018 and expect the price to be in the range of US$1,550 to US$1,600 an ounce. Expectations of higher inflation in the latter part of 2018 and going into 2019 will be a key tailwind for the gold price. An accommodating US Dollar on the gradualist approach by the US Federal Reserve and rising competitive currency will also push the gold price. Furthermore, the “safe haven” characteristic in gold cannot be ignored given the state of global events.
A robust free net mine cash flow from operations of A$111.4 million for the March quarter, represented a rise 1.0% on the same metric from a year earlier.
The cash flow outcome allowed the company to further strengthen its balance sheet.
Net debt at 31 March 2018 was reported at A$187 million, being well down on the A$541.2 million reported from a year earlier. Cash on hand jumped to A$208 million at 31 March 2018, which was significantly higher than the A$21.9 million held at 31 March 2017. Debt at the same date as cash stood at A$395 million, which was down on the debt position of A$560 million at 31 March 2017. On the brief detail provided, we have no concerns over the debt level or the quality of the balance sheet. The company will provide greater clarity around its financial position with the release, during August 2017, of its full year result for 2018.
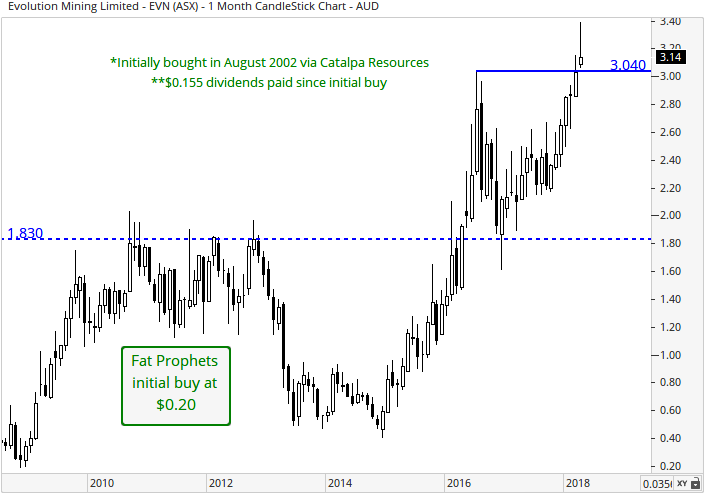
We believe that Evolution Mining (ASX:EVN) has a suite of quality gold assets with the brownfield expansion capacity to positively influence its growth profile. Moreover, Evolution Mining has a robust balance sheet to act as a springboard to deliver future growth. In addition, the company’s strivings to reduce costs and maintain a squeaky clean balance sheet are exemplified in the March quarter results.
Consequently, Evolution Mining (ASX:EVN) continues to be recommended as a high conviction buy for to Members with no exposure to the stock.
Disclosure: Evolution Mining (ASX:EVN) is held within the Fat Prophets Global Contrarian Fund, Fat Prophets Concentrated Australian Share, Mining & Resources and Small & Mid Cap Portfolios.

