
FY18; still surging ahead
BHP Billiton’s 2018 result continued to surge ahead of the turnaround result it reported for 2017, but it did come in shy of market consensus. The company’s underlying profit surged by a third again in 2018, with realised commodity prices and its operations playing a positive role in the result. Operating costs were a drag but were contained, given the additional activities. The dividend surged, based on the current policy setting for dividends, however there were no other shareholder capital management initiatives offered. The balance sheet does though continue to remain amply robust.
The following table shows a summary of the company’s 2018 result (EBITDA- Earnings Before Interest and Taxation Depreciation Amortisation):

Source: BHP Billiton
As Members can see from the above table, the company reported a significant surge in its 2018 underlying profit (Total operations) of 32.7% on 2017, to US$8.9 billion. Market consensus for the same metric was set at US$9.18 billion, with a full year dividend of US$1.30 per share. Although the announced number was shy of consensus, we consider the result to be a good one, and reflects managements’ mantra to generate value right across the total commodity cycle.
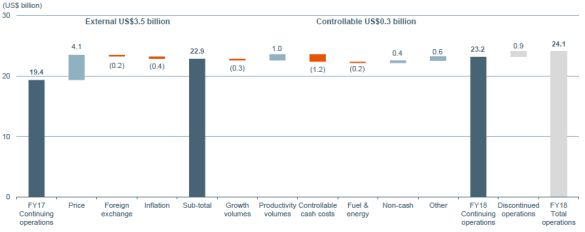
At the underlying EBITDA line for continuing operations, the company reported a 19.6% rise compared to 2017, to US$23.2 billion. The following chart shows the major influences on the company’s underlying EBITDA for continuing operations in 2018:
Source: BHP Billiton
Looking at the external factors shown in the above chart, Members can see that price was the biggest single dominating influence on the 2018 result.
Rising commodity prices contributed a positive US$4.1 billion to the 2018 result, compared to the positive US$8.2 billion in 2017. Realised commodity pricing momentum was lower in 2018, compared to 2017.
The company reported positive price variances across three of its four key operating units in 2018. The following chart shows the contribution by each of the company’s four operational units on the 2018 positive price variance outcome:

Source: BHP Billiton
A firmer US Dollar in the latter part of the company’s financial year did have a negative impact on the broader commodity prices, to slow-up the broader rally that was occurring at the time in commodity prices. The US Dollar firmed on expectations that trade tariffs would repair its deficit trade balances with many countries, with China especially singled out by the US.
Pleasing in the pricing result were both copper and petroleum, while long-time stalwart iron ore broke down. Iron ore prices weakened over the 2018 financial year for the company on over supply concerns and the tariffs introduced by the US on steel imports into that country. Both copper and oil prices improved on supply concerns and rising demand. The growing concern of supply deficits for both was a major driver. Coal prices rose on demand remaining stable and from a very low base due to climate change concerns.
Going forward our positive view on commodity prices has been clouded by the trade wars, which may impact future economic growth rates for various countries and with that commodity demand. China being a major participant in these wars (not by its design) is a major concern given its appetite for commodities.
These wars and any outcomes may take time to play through into country and global numbers, which may concern investors.
From the external factors to the controllable influences (on the right of the sub-total in the first waterfall chart) that impacted underlying EBITDA in 2018. The two influences that the company does control, in volumes and cash costs, moved in opposing directions, with cash costs deteriorating while volumes improved.
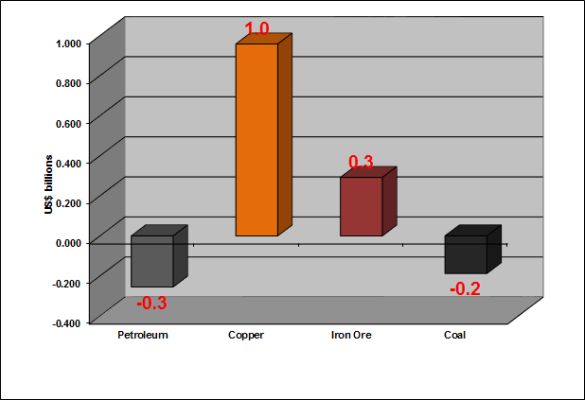
The contribution from volumes was a positive US$700 million, with the unit contributions shown in the following chart:
Source: BHP Billiton
As Members can see from the above chart, copper and iron ore contributed positively to the year’s result, with petroleum (a perennial laggard) and coal offsetting negative contributors. We reviewed the company’s 2018 operational performance in FAT-AUS-884 and would refer Members to that review. We were pleased with this aspect of the company’s full year result.
Cash costs have been a standout for the company over the past four financial years, with the company reporting positive contributions. For 2018, the contribution was a negative US$1.2 billion. Greater mining activity and adverse currency movements played a major role in the negative performance. The following chart shows the company’s annual productivity gains:

Source: BHP Billiton
As Members can see from the above chart, the rate of cost removal is slowing as the company has already removed significant costs in previous years; this can be expected to happen. We are comfortable with the company’s cost-out actions to date. The company continues to indicate that its EBITDA margin remains well above its peers, with its figure coming in at 55% for 2018. The company is guiding for cost gains of US$1.0 billion going out to 2019 and has indicated that it remains on track to meet 2019 numbers.
The magnitude of the increases in the prices for the company’s product offerings in 2018 flowed through to net operating cash flow, which increased by 9.9% on 2017, to US$18.5 billion. The following chart shows the company’s annual net operating cash flow:

Source: BHP Billiton
Revenue in 2018 grew by 21% compared to 2017, to US$43.6 billion and on the back of this result net operating cash flow improved. Higher costs and capital spending dragged on the cash flow result, but it still expanded for the year. The company strives to ensure that free cash can support dividends, sustain operations and also drive growth. The 2018 net cash flow result achieved the company’s goals.
Capital and exploration spending for 2018 totalled US$6.8 billion, which represents an increase of 29% on 2017. The following chart shows capital spending for 2018 and the 2019 forecast (including 2019 constituent parts):

Source: BHP Billiton
We are very pleased with the company’s change in direction with regard to its capital spending. We believe the change has come with the improved financial structure of the company. The long-life characteristic of many of the company’s assets can be scaled to generate growth, but opportunities do eventually run dry. For 2019, the company is forecasting a capital budget of circa US$8 billion and its constituent components are shown in the above chart.
The company continues to place a high priority on maintaining a robust balance sheet and continued with that theme in 2018. As with 2017, we believe the time for a theme change is close at hand. The following chart shows the net debt and gearing ratio (net debt to net debt plus assets, the coloured zone is BHP’s target range for net debt and its gearing):

Source: BHP Billiton
Net debt at 30 June 2018 stood at US$10.93 billion which is very favourable against the US$16.1 billion from a year earlier. Of net debts’ constituent parts, both total debt and cash rose compared to their year earlier counterparts. Total debt declined to US$26.8 billion at 30 June 2018, falling by US$3.7 billion from end-2017. Cash to the same date as debt came in at US$15.9 billion compared to US$14.2 billion at 30 June 2017. As Members can see from the above chart, gearing took a step forward in 2018 to 15.3% from 20.6% at the end of 2017. We have no concerns over the current structure of the company’s balance sheet.

The 2018 dividend reflected the company’s policy to payout a minimum 50% of each year’s underlying earnings after taking account of capital needs. With the profit surge, so did the full year dividend surge for 2018 to US$1.18 cents per share. This was well ahead of the full year dividend of US83 cents per share declared in 2017. The company did pay a second half record dividend of US62 cents per share. We are a little disappointed that the company did not initiate a share buy-back. Share buy-backs are value adding for current and future shareholders.
BHP Billiton is now investing a bigger capital pool to develop its tier 1 long-life assets and other opportunities. The advantages are paramount when developing brownfield projects while new projects bring with them new potential.
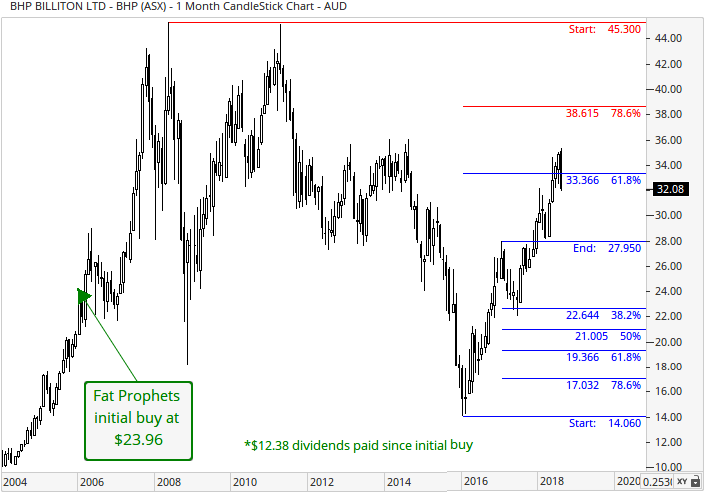
BHP Billiton, we believe, has the financial and management capability to deliver shareholder value across commodity cycles. The 2018 financial result has done nothing to sway our belief in the company’s long-term value proposition.
Our positive outlook on the base metals, over the medium to longer term, in our opinion, places BHP Billiton in a position to leverage into any improvement in the market, although this view has been tempered by short-term price volatility. Events occurring in the broader global economy, including trade wars and sanctions do require attention and may cause stress on equity markets in the future.
Consequently, we have changed our recommendation for BHP Billiton back to a hold for the time being.
Disclosure: BHP Billiton is held within the Fat Prophets Mining and Resources, Concentrated Australian Share, Concentrated UK managed account portfolios and the Fat Prophets Contrarian Fund.

