
Light on the Horizon for Spark
Spark New Zealand’s (ASX:SPK) reported profit in FY18 continued to be somewhat hamstrung by its cost reduction plan dubbed the “Quantum Programme”. However, we believe the short-term pain will lead to long-term gains and are content with the annualised benefits flowing through. Implementation costs are expected to moderate this fiscal year. Adjusted for the Quantum costs, the operating profit performance was adequate and positive for yield hunters; the declared total dividend for the year was unchanged.
Australian-listed shares of Spark have staged a decent recovery from 52-week lows visited earlier in 2018.
1H18 highlights –NZ Dollars unless noted otherwise
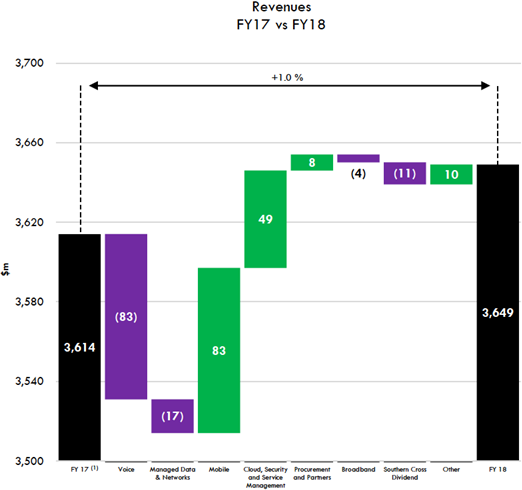
Revenues ticked up $35 million, or 1.0% to $3.649 billion, driven by growth in mobile (+6.9%), cloud, security and service management (+15.1%). That more than offset continued declines in the legacy voice (-12.7%) and managed data and networks areas (-8.2%).
This was an extension of expected trends. Mobile, cloud, security and services revenues now account for 45.3% of total revenues, up 5.5 percentage points over the past two years.
Source: Spark New Zealand (ASX:SPK)
Mobile revenue growth of $83 million was comprised of a $36 million (+4.6%) increase in high margin service revenues on the back of higher ARPU (average revenue per user) and connections growth. Another $47 million (+11.3%) stemmed from other mobile revenue due to customer demand for high-end mobile devices. Cloud, security and service management growth of $49 million reflected strong demand for cloud-based “as-a-service” products – an industry-wide trend.
There was an acceleration in the rate of decline in voice revenues of $83 million (-12.7%) due to lower wholesale PSTN connections and reduced calling volumes. The $17 million decline (-8.2%) in managed data and networks revenue reflected pricing pressure and customer migration from traditional managed data products to new lower priced fibre alternatives.
Southern Cross dividends declined by $11 million to $50 million during FY18, and the expectation is for the dividends received from the Southern Cross business to decline further during FY19 to between $10 million and $20 million. This is due to lower levels of pre-purchased capacity from large customers, and the trend has been flagged previously as the remaining life of the existing Southern Cross cable network reduces.
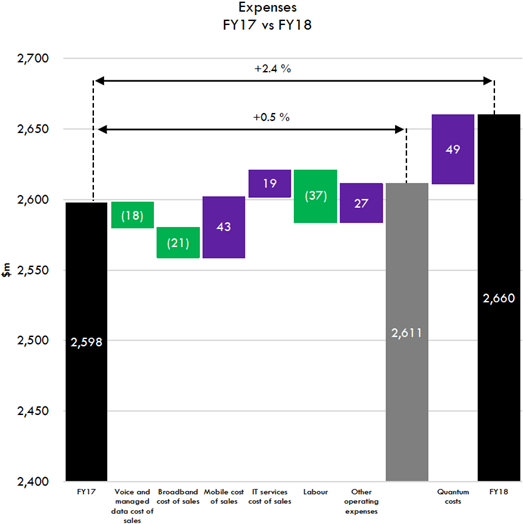
Group operating expenses increased 2.4% year-on-year to $2.66 billion, with cost increases to support top line growth and the accelerated implementation of the Quantum programme featuring in the increase. Excluding the Quantum programme costs, operating expense growth was contained to just 0.5%.
There was a 7.1%, or $18 million decline in voice, managed data and network costs due to lower voice connections, especially in wholesale. Broadband cost of sales fell $15 million, or 4.8% on a reduction in access costs due to the ongoing adoption of wireless broadband, partially offset by regulated increases in wholesale access charges for both fibre and copper.
Mobile costs increased $43 million, or 9.9% reflecting higher demand for premium devices and adoption of value added services. IT services cost of sales increased 4.5%, or $19 million to support growth in higher margin cloud and security products revenues, along with low margin, customer demand driven, procurement revenues. Other expenses increased $27 million, or 5.4%, driven by higher advertising costs linked with key marketing campaigns and product launches. There were also higher platform expenses due to customer and usage growth for the Lightbox video streaming service.
Source: Spark New Zealand (ASX:SPK)
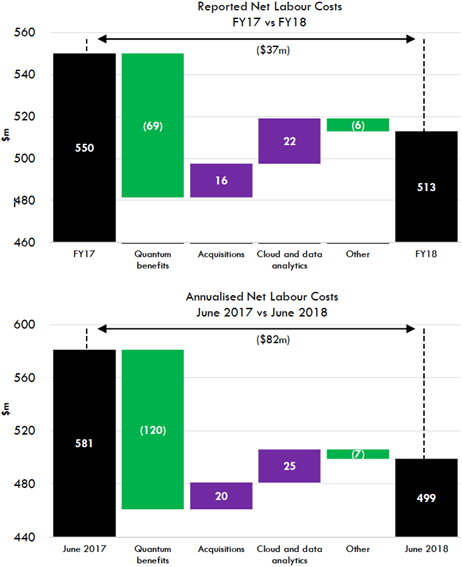
There was a net $37 million, or 6.7% reduction in labour costs from the benefits of the Quantum programme. During FY18 annualised net labour costs were $82 million lower to $499 million.
Benefits from the Quantum programme are forecast to reduce annualised net labour costs to around $470 million during the first half of fiscal 2019. Total implementation costs linked to the initiative were $49 million in FY18.
Source: Spark New Zealand (ASX:SPK)
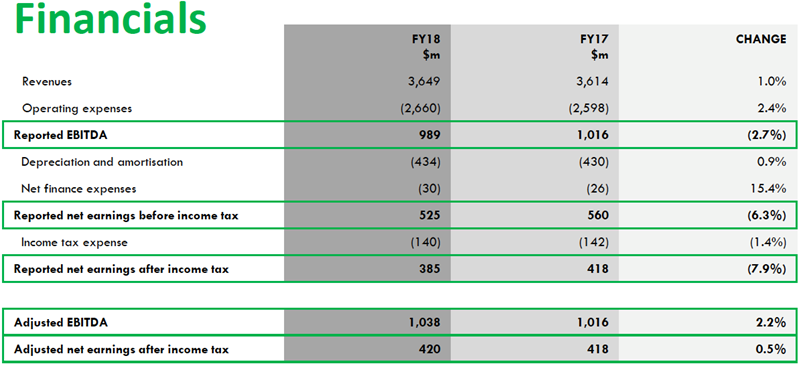
Reported EBITDA of $989 million represented a decline of 2.7%, or $27 million from a year ago due to the costs linked to the Quantum initiative. The reported EBITDA margin declined 1.0 percentage point to 27.1%. Excluding the Quantum expenses, the adjusted EBITDA margin increased 0.3 percentage points to 28.4% and adjusted EBITDA grew $22 million, or 2.2% to $1,038 million.
Source: Spark New Zealand (ASX:SPK)
Depreciation and amortisation, interest and tax expenses were relatively little changed on an absolute basis between the two periods. Reported net earnings after tax fell 7.9%, or $33 million to $385 million. That was broadly in line with expectations. Reported earnings per share of 21.0 cents was down 7.9% from 22.8 cents in FY17.
Net earnings adjusted for the $49 million in costs associated with the Quantum programme came in at $420 million, edging up 0.5% from $418 million a year earlier. That equated to adjusted earnings per share of 22.9 cents, up marginally from 22.8 cents in FY17.
Spark declared a second half ordinary 11 cents per share dividend, flat with a year ago. The company also declared a special dividend of 1.5 cents a share. Both were imputed at 75%. The full year total dividend of 25 cents per share was also unchanged with that declared in FY17.
Looking briefly at the key mobile segment, and as stated earlier total mobile revenue increased by $83 million, or 6.9%. That accounted for 35.1% of total operating revenues, reflecting a 2.7 percentage point increase year-on-year. An unlimited consumer mobile plan and increased migration from pre-paid to pay-monthly resulted in pay-monthly connection growth of around 70,000 (6.3%). Average revenue per user in the segment ticked up 1.2%, driven by the introduction of unlimited consumer mobile plans. The company had roughly 2.4 million mobile customers at the end of FY18, up over 2% from a year earlier. Gross margin for the segment increased $40 million, or 5.3% year-on-year.
The Lightbox user base increased by 37% during FY18, to over 355,000. New revenue streams for the platform were launched, including a pay-per-view movie service and a kids’ area. The company has also won the content rights for the upcoming World Cup Rugby and English Premier League, from the 2019 season. The strategy will be focused on standalone monetisation of that content.
In terms of strategic priorities, for Spark these are wireless technologies, using its multi-brand strategy to better serve the growing price-sensitive part of the market and becoming the lowest cost operator through simplification, automation and digitisation.
In the first strategic priority area, the introduction of the unlimited mobile plan helped ARPU edge up year-on-year. 4.5G technology is live in 31 locations, expanding network speed and capacity and making wireless broadband available to more households.
About 51% of broadband customers are now on new (fibre and wireless) broadband technologies, with 116 thousand on wireless broadband. That is positive for Spark, as it helped generate $29 million of year-on-year access cost reductions in FY18 and $51 million of associated annualised benefits. Gross margin for broadband increased by $17 million, or 6.7% year-on-year. The company is seeking to be mostly ex-copper by 2020.
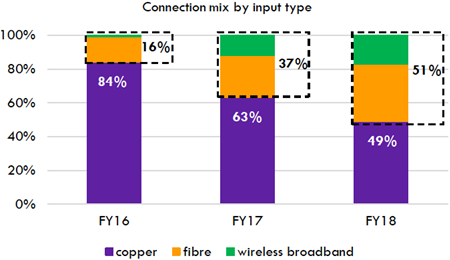
Source: Spark New Zealand (ASX:SPK)
Regarding price-sensitive customers, the Skinny and Bigpipe sub-brands have hit a chord with their targeted customer base, delivering most of Spark’s FY18 total broadband connection growth of 13,000. It is still early days however, with these brands accounting for just 5% of the total broadband base, although that has more than doubled from the 2% in June 2016.
On the final strategic priority and that is being the lowest cost operator. Spark’s scale places it in a strong position and the Quantum programme has been delivering the desired benefits, albeit with variable timing. Implementation costs are expected to be at more typical levels in FY19. Although the initiatives are crimping profits in the short-term, they will boost long-term profits and along with other so-called ‘Agile’ initiatives, Spark (ASX:SPK) is modernising its business.
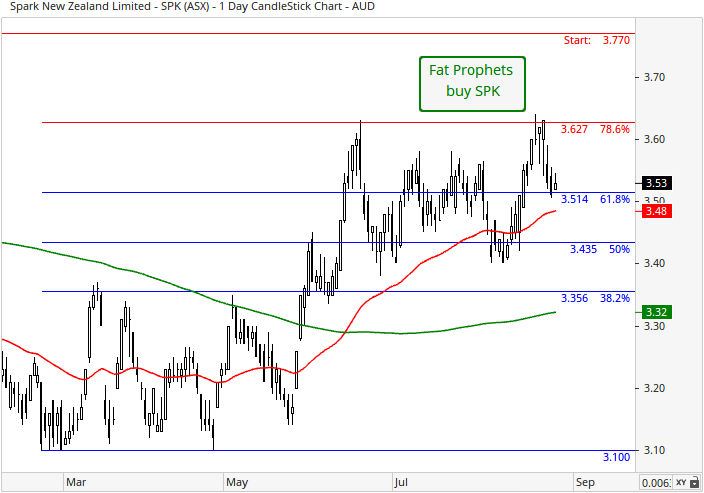
Turning to the daily chart, a zone of resistance has been breached between the $3.32 and $3.43 region. This is made up of the 200-day moving average (green line) and the 50% Fibonacci retracement respectively. A sustained break above this price range would swing medium-term momentum north. If this scenario was to evolve, then the stage is set for further gains to unwind over the longer time horizon. Resistance at the 78.6% Fibonacci retracement at $3.63 was backed away from recently. A bounce up from the 61.8% Fibonacci retracement at $3.51 would bolster the technical picture.
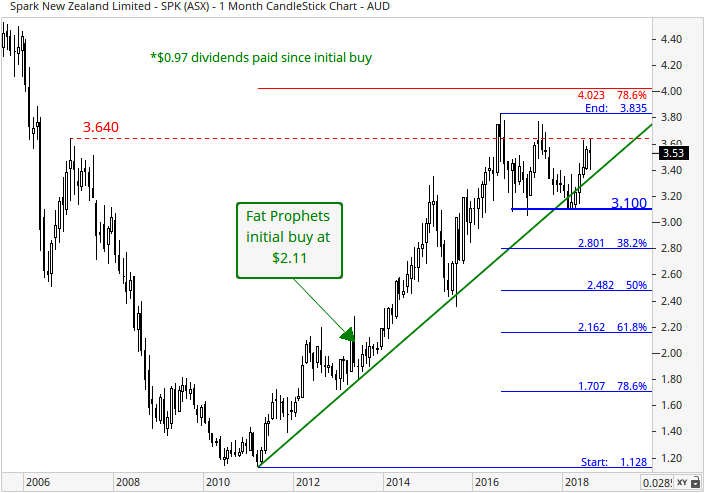
With reference to the monthly chart, the long-term uptrend line (upward sloping green dashed-line) was breached in February. The long-term technical outlook has since improved, with prices reclaiming above the aforementioned uptrend line. This now increases the probability of an eventual challenge of resistance situated between $3.64 and $3.84. This is made up of the January 2007 (horizontal dashed-red line) and August 2016 high respectively.
Summary
Although reported profits are still being crimped by its cost-out Quantum programme, the annualised benefits are flowing through. Other strategic initiatives are also making traction, with
a more “agile” management structure appearing to be paying off on the productivity and customer experience front. Spark’s differentiated offerings in the Mobile, Media and Broadband spaces support market share growth, as do its cloud offerings. We believe Spark to be transforming into a more modern telecommunications company, while retaining its strong brand in the New Zealand market.
From a valuation perspective Spark trades on around 17.8 times forecast FY19 earnings, falling to 16.5 times the following year. Meanwhile the projected dividend yield over the same time frame 5.9% expanding to 6.5%.
We retain our Buy rating on Spark New Zealand (ASX:SPK) for Members with no exposure, and with a medium to long-term investment horizon.
Disclosure: Spark New Zealand (ASX:SPK) is held in the Australian Share Income, Concentrated Australian Share and Small/Mid-Cap Models.

