
Spreading the wings
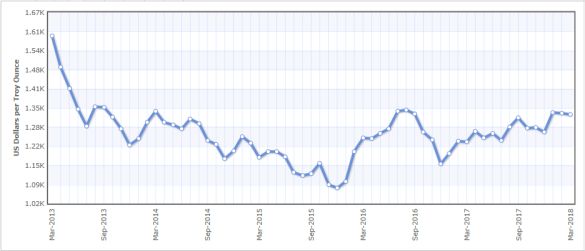
The gold price has since our last review of the ETFS Physical Gold ETF (ASX:GOLD) in July, moved positively on notable tailwinds. A compelling story around the appearance of inflation in 2018 and beyond, coupled with an accommodating US Dollar should produce price tailwinds for the precious metal. With the current physical gold market now more supportive of a price rally, the broader factors appear to very much favour a sustained gold price rally. The following chart shows the gold price:
Source: Index mundi
The gold price is currently trading around US$1,334 an ounce, which is a 7.4% increase compared to the US$1,242 an ounce at the time of our last review. A weaker US Dollar over the time has been aided by a growing concern around inflation and a supportive physical market. The “safe haven” premium in the gold price has come and gone, but it certainly remains a factor that appears to be always in the wings in the current global geopolitical arena.
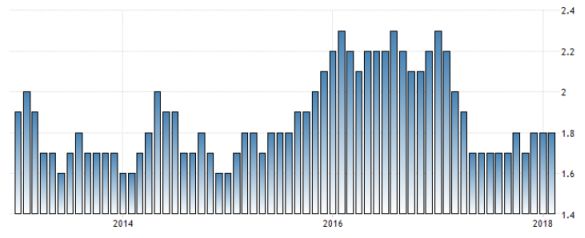
One of the forces we expected to drive the gold price higher in 2017 was inflation, and on this front it did not play out, as although inflation increased late in 2017, the rate of change was very subdued. The following chart shows the United States (US) Core Inflation over the past five years (year-on-year percentage change):
Source: Trading Economics
Inflation looked to be creeping into the US economy in early 2017, but was stiffled by a less accommodating US Federal Reserve (Fed) with a paced programme of rising US cash rates to curb excess inflationary pressures in the economy.
The Fed remains committed to a paced out increase in US cash rates in 2018 and 2019 to combat any inflationary pressures that may arise. In 2018, the story has changed with a US instigated tariff war first on steel and aluminium imports and now more broadly on Chinese imports and now Russian imports. China has retaliated with a proposed suite of tariffs on US imports; while Russia has yet to fire a return shot. The upshot of these wars will see the cost of goods and food stuffs in both countries increase and do so rapidly, as the tariff impacted items feed into pricing within each economy.
We expect to see an escalation in the inflation rate at a pace akin to that seen in the early part of 2017, with the difference being persistence in 2018. We do not expect to see inflation drop away in 2018. A higher inflation rate and a perception of it accelerating will add a significant tailwind to the gold price over the remainder of 2018.
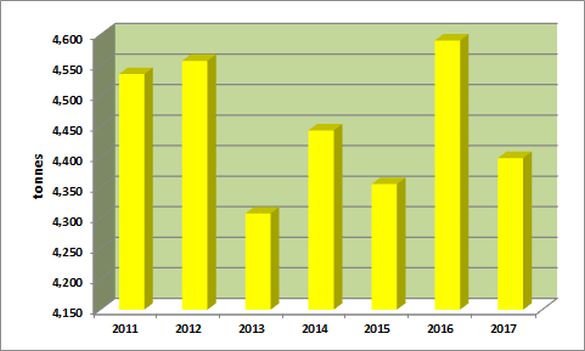
Turning to the physical gold market, we have seen some assistance in a higher gold price from the quarter, with demand in key metrics improving in 2017 while supply has been curtailed. On the supply side, the total supply of gold fell in 2017 compared to 2016, and is shown in the following chart on an annual basis:
Source: World Gold Council
The total supply of gold to 31 December 2017 fell by 4.2% compared to a year earlier, to 4,398 tonnes. Driving the result was a fall in recycled gold of 10.4% compared to 2016, to 1,160 tonnes. Importantly, mine production which had been pushing higher over the past five years from 2,744 tonnes in 2011, was flat in 2017 compared to 2016, at 3,269 tonnes. Given the positive price movement in the gold price, we would have expected the rising production trend to remain intact. Going forward, we anticipate the total supply of gold will return to modest growth on higher forecast gold prices and therefore act as a headwind on any price rally.
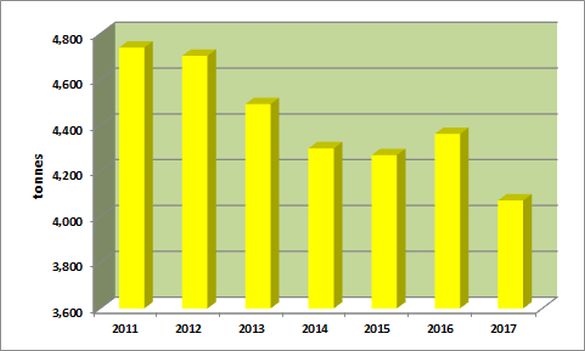
The demand for gold has been very disappointing, with the firmer gold price curbing demand, as would be expected. The following chart shows annual gold demand:
Source: World Gold Council
Total gold demand compared to a year earlier fell by 6.7%, to 4,072 tonnes, as gold as an investment fell away. First to real demand, and here jewellery demand climbed by 4.0% compared to 2016, to 2,136 tonnes, to reverse the recent trend of falling demand. A better economic outlook and improving consumer confidence, especially in Asia drove jewellery demand. We expect the sector will continue to modestly grow over 2018. We expect higher gold prices will however be a curbing factor.
Gold used in technology saw demand also increased over 2016, to 333 tonnes representing a 2.9% increase on 2016. Gold demand in this segment also reversed its recent trend of falling demand. Demand in the technology sector was driven by a broader improvement in growth in the sector going forward. We expect the sector will continue to show positive growth, but the recent tariff wars are concerning.
The fall in demand came from investments, as the “safe haven” and “inflation proofing” premiums receded in investors’ minds. Demand in this sector fell by 23% on 2016, to 1,232 tonnes. Central banks and other institutional holdings also fell by 4.7% compared to 2016, to 371 tonnes. Our expectation is for the “inflation proofing” premium to return in 2018 and positively impact the gold price. The actions of central bank could be, at best neutral, over the remainder of 2018.
The upshot of the movements in gold demand and supply for 2017 saw the overall market move to a large surplus position of 340 tonnes, or 18% higher on 2016.
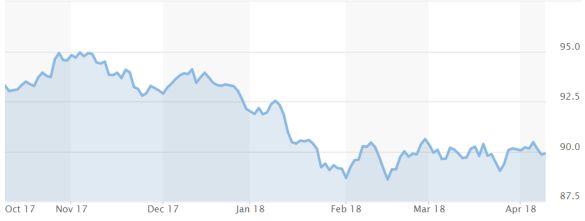
The US Dollar has had a positive influence on the gold price in the early months of 2018. The following chart shows the US Dollar Index:
Source: Marketwatch.com
The US Dollar Index has fallen 2.6% from the end of 2017, to 90.0 currently. The US Dollar Index has weakened on the back of concerns over Donald Trumps’ actions to reduce taxation and increase federal spending. Trump has created a recipe to generate wider federal budget deficits and higher federal borrowings. The US Federal Budget is forecast to hit US$1.0 trillion in 2020. Investors will keep the US Dollar on the back foot, as this scenario unfolds over 2018 and beyond.
The Fed has also mapped out a campaign of only gradually lifting US cash rates with a further two 25 basis point increase in 2018 and two in 2019. This forecast gradualist approach should continue to keep the US Dollar off the high yield currency list, especially as other central banks start to lift cash rates., and therefore on the back foot. A danger lay in the Fed having to escalate the cash rate increases on growing inflationary pressure. A higher US Dollar would ensue, but the above fiscal pressure will, we believe, counter such a rally.
“Safe haven” buying of gold will always be trigger to act as a tailwind on the price with events, and although difficult to predict, these events are becoming more prevalent.
In our 2018 forecast that was published at the beginning of the year, we expected the gold price to close the year out in the range of US$1,550 to US$1,600 an ounce; our view remains unchanged.
With the broader macro factors still in play in the global economy, our view for the gold price in 2018 remains positive.
Rising inflation in the latter part of 2018 and pressure being brought against the US Dollar; bodes well for the gold price. Accordingly, we have changed our recommendation for the ETFS Physical Gold ETF (ASX:GOLD) to a buy for Members with no exposure to the vehicle.

