
Beefing up
After a stellar performance in 2017, Elders’ (ASX:ELD) share price was on the back-foot for much of the first quarter of 2018, as gains were taken off the table and the broader market correction kicked in. Investor sentiment though has turned around in recent weeks, with the revelation of stake-building by a Chinese conglomerate. Further business optimisation in the form of a divestment and two acquisitions was also announced yesterday by the company and welcomed by investors.
The company has also it seems been immune to global investor concerns over the trade rift between the US and China. This in our view speaks to the supportive macro thematic which underpins Elders – the increasing demand for meat products as dietary habits evolve, and particularly in the Asian region.
What’s new?
Since our last review, investor sentiment towards Elders (ASX:ELD) has been fairly weak, or that is until a substantial holder notice was lodged in late March. The Hong Kong and Sichuan Province-based Sichuan Hebang Biotechnology Corporation (SHBC) has lifted its stake to 5.1% with the purchase of 5.8 million shares. This comes on top of a larger block acquired in September last year, and makes SHBC one of the top five shareholders.
The conglomerate has a wide array of business activities in China, but has had exposure to the Australian farming sector through the leather exporter HJ Hides and Skins, which is based in Melbourne. The acquirer’s interest was evidently piqued by an Elders corporate presentation event in China a year ago. Elders CEO Mark Allison has also commented that “They like our strategy and seem to favour a long term investment in Elders.”
It would therefore seem that the stake is a strategic one with SHBC having some first-hand knowledge of the strong outlook for the Australian farming sector. A full tilt for Elders wouldn’t be possible given the Australian company’s strategic and geographical importance. It is also notable that the conglomerate has remained invested despite a strong share price performance since their initial purchases last year. The revelation that they have topped up at the lows in March sends a strong signal that SHBC sees Elders as a long term investment.

Source: investor Presentation
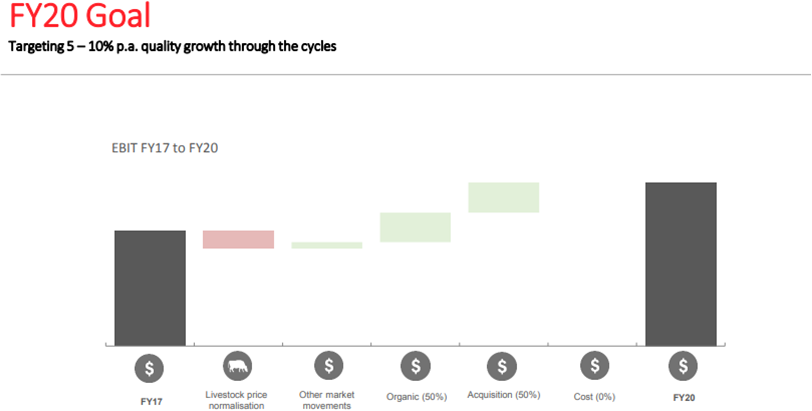
And of course there is a lot to like about Elders (ASX:ELD), which as we discussed in our last review, is kicking goals both operationally and financially. Management’s Eight Point Plan has been a strong success thus far, with a target for EBIT ‘quality’ growth of 5-10% per annum through to 2020.
Source: investor Presentation
After shoring up the balance sheet post the GFC, the recovery at Elder’s has been impressive, underpinned by strategic initiatives, along with accretive acquisitions. Higher livestock prices have also bolstered earnings – underlying net profit rose some 40% last year.
Management in our view have to be commended for the way in which the business has been lifted, which has helped drive a dramatic share price re-rating in recent years. They have not rested on their laurels either, looking to deliver further operational improvements where possible. Another was forthcoming yesterday with the company announcing that it is divesting an underperforming asset in Indonesia, while growing its chemicals livestock businesses in Australia.
The company has announced that it will sell its Indonesian feedlot and abattoir subsidiary following a comprehensive performance review. Mr Allison noted that “High cattle costs and changing Indonesian governmental policies have adversely affected the performance of our Indonesian business, making it appropriate to divest these assets.“ The company expects to move $10 million of working capital from the business into higher returning assets, including its Indonesian retail meat distribution business. The deal is expected to complete in June.
The company also announced on Monday that it was acquiring Titan Ag, an Australian-based producer and supplier of crop protection and animal health chemicals and fertilisers. The price being paid is 5 times average normalised earnings. Elders expects Titan to generate additional earnings (EBIT) of $6.5 million to $7.5 million in its first full year of ownership.
Management know the company well, with Titan selling is products exclusively through Elders since 2006. The purchase price is payable in three tranches, with 70% on completion, and 10% and 20% on the first and second anniversaries, with an earn-out hurdle. The transaction is expected to complete 1 May 2018.
The deal looks a good one and is complementary to Elders’ existing footprint in agricultural chemicals.
It also highlights the increasingly key role this sector will play in meeting the world’s increasing demand for food. We have also backed this thematic with our exposure to Nufarm.
Elders (ASX:ELD) also revealed that it is buying Kerr & Co Livestock, the largest privately owned independent livestock business in south-west Victoria. Management sees the deal as increasing the company’s agency business in a highly valuable livestock region. Last year Kerr handled about 416,000 sheep and 16,000 cattle. With meat prices on the rise, underpinned by rising demand in Asia, this also looks like a smart move.
Recent developments add further credence to our belief that Elders (ASX:ELD) can hit the mark in terms of sustained earnings growth.
We are also content that Elders’ balance sheet is in good shape, paving the way for continued dividends (the 2017 pay-out was the first in nine years) going forward and more accretive acquisition activity to support organic growth initiatives. Cash generation in fiscal 2017 was strong with free cash flow of $78.1 million.
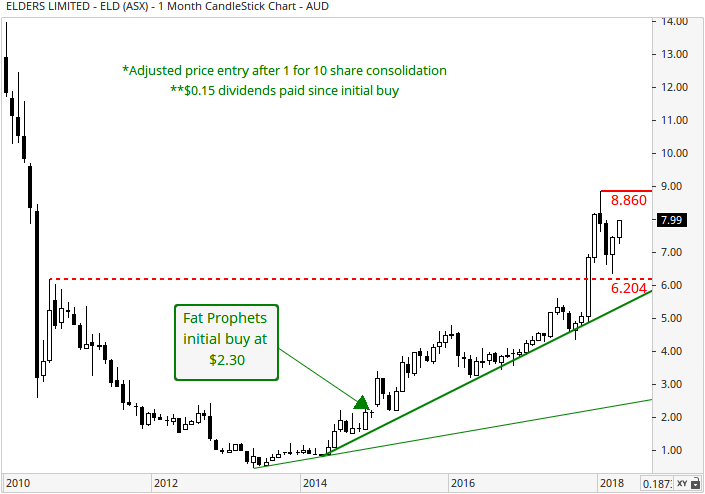
Turning to the technical picture and looking at the monthly chart, the share price of Elders (ASX:ELD) has traded consistently higher since 2013, underpinned by a rising trend line (upward sloping solid-green line). Above, overhead resistance is situated at the January intra-month high of $8.86 as marked by the horizontal solid-red line. We would expect this level to eventually give-way to the bull camp, and further gains to evolve over the broader horizon. Adding to the bull case is the strength of the underlying long-term uptrend, which has been in place since mid-2014.
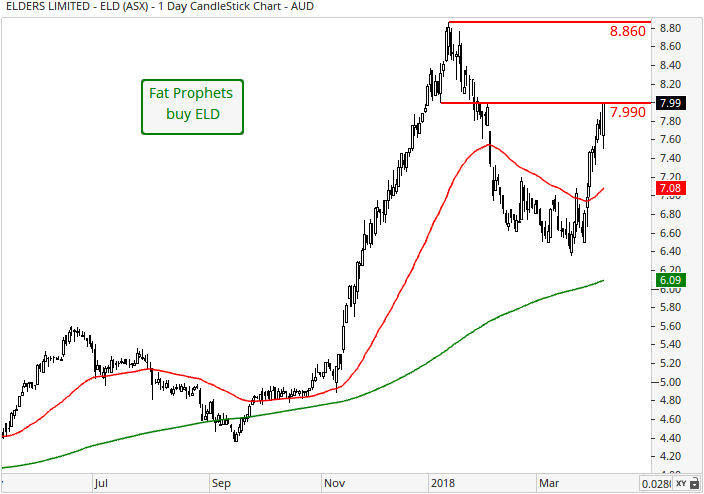
Turning to the daily chart, overhead resistance is situated at the January intra-month high of $8.86 as shown by the horizontal red line. A temporary pullback in price since our last review has seen support around the $6.30 mark hold, which is encouraging. Medium-term momentum remains in favour of the bulls, as the share price has comfortably cleared both the 50 (red line) and 200 (green line) day moving averages.
Summary
After a stellar performance in 2017, Elders’ share price was on the back-foot for much of the first quarter of 2018, as gains were taken off the table and the broader market correction kicked in. Investor sentiment though has turned around in recent weeks, with the revelation of stake-building by a Chinese conglomerate. Further business optimisation in the form of a divestment and two acquisitions was also announced yesterday by the company and welcomed by investors.
The company has also it seems been immune to global concerns over the trade rift between the US and China. This in our view speaks to the supportive macro thematic which underpins Elders – the increasing demand for meat products as dietary habits evolve, and particularly in the Asian region.
On the valuation front, Elders’ forward FY18 earnings ratio of 13.6 times is attractive factoring in the company’s growth potential. Returns are also expected to be supplemented by a dividend yield of roughly 2%.
With that in mind, we recommend Elders (ASX:ELD) as a high risk buy to Members without exposure and with a medium to long term investment horizon.
Disclosure: Elders (ASX:ELD) is held in the Concentrated Australian Share and Small/Mid-Cap Models.

