
To New Chapters
Fiscal 2018 was a solid year for consumer credit player, FlexiGroup (ASX:FXL), which reported marked improvements across key metrics, supported by the prudent retirement of legacy brands (instead of pointlessly holding on) and replacing them with more ‘relevant’ brands. While the shares have yet to perform, we remain encouraged by the company’s outlook under new leadership.
What’s New?
Our last coverage of the stock was in March (FAT-AUS-864) where we focussed on the company’s interim results which showed that it was delivering enough momentum, amidst headwinds, to hit guidance targets for the fiscal year.
Since then, the company has reported FY18 numbers – which will be the key focus of today’s note, which we highlighted in a MWA. Another salient update came early August when the company announced the departure (effective 03 September 2018) of then-CEO Symon Brewis-Weston (below, left), who will be replaced by Ms Rebecca James (below, right):

Image Credit: Karen James & Prospa
In the filing, Ms James will be joining the company next week, on the 15th October. She previously worked as the Chief Marketing and Enterprise Officer at small-business lender Prospa. Ms James has extensive experience in customer-centric roles across various financial services companies and was also heavily involved in commercialising the digital solutions for her previous employers.
The market didn’t react kindly to the surprise departure of Mr Brewis-Weston, but we believe this transition augurs a new chapter for Flexigroup where, after shaving off the 24-year old Flexirent business, can now focus on growth.
In fact, Ms James has a stellar track record in growing the customer base, with a case in point at ME Bank where she expanded the customer base by 40% during her tenure, while Prospa is currently the top dog in the small business online lending category.
Though, only time will tell whether Ms James can truly deliver; in the meantime, we look at the FY18 results in greater detail:
FY18 Results Review – Currency in A$ unless otherwise indicated
This FY was quite a solid year for Flexigroup (ASX:FXL) which continued to register momentum despite the “retirement” of the FlexiRent brand. The company delivered volume growth with an increase in all key operational metrics from Customers (finally hitting the 1 million mark) to Volume and Receivables amongst others. The graphic below summarises the highlights of this year’s achievements:

Source: 21 August 2018 Company Presentation
Looking at just the raw numbers though, and we see that Revenues (total portfolio income) were slightly lower (-0.5%) year-on-year to $460.4 million. This was largely due to unfavourable year-on-year comparisons from the Consumer Leasing business, wherein FlexiRent was a part of.
There was also an unfavourable impact from forex movements (AU$/NZ$) though both of the above were partially offset by the successful take-off of the new Lisa and Smartway brands ahead of competitors.
The graphic below summarises the volume trends of the 6 business segments:

Source: 21 August 2018 Company Presentation
A particularly important contributor to this year’s results was the Australia Card business which continued to report momentum, marking growth in various metrics from Customers (+22% yoy), increased spending from customers via larger Volumes (+38.6%), and larger transaction sizes with receivables up 33.3% year-on-year to $643.6 million.
Going forward, we expect momentum to remain strong given the upcoming launch of a new card (Skye) as well as a continued increase in average spend. In the near term there will be costs incurred – in fact operating expenses increased 40% year-on-year to $25.1 million – this will taper off as ‘launch’ (marketing & development) spending winds down.
The NZ Cards business also reported strong volume growth, up 14% year-on-year to N$710 million, though slightly slower in A$ (+12.2% yoy) due to an unfavourable exchange rate move. Growth was also supported by a healthy 18% year-on-year growth in customers to over 480,000 while Receivables had a slightly slower pace (+9% yoy) improvement.
Despite rapid growth, operating expenses fell 17% year-on-year to $35.3 million. The large decreases in operating expenses here was the result of synergies gained from combining operations with the NZ Leasing business.
However, given the unfavourable currency movements and flattish customer growth, NZ Leasing topline saw a decline of 7% to $30.9 million with a dip in Volumes (-3% yoy) and Receivables (-14% yoy).
Going forward the NZ businesses (Cards + Leasing) are expected to register more growth as the company ramps up retail partner engagement and accompanies it with product launches.
Next is the Certegy business, which based on our previous coverages (FAT-AUS-838) reported headwinds from margin pressures and mounting costs. However, since hitting the nadir in 2H17, the segment has reported recoveries in volumes with 2H18 up 10% year-on-year to $274 million and Receivables up a healthy 5.8% year-on-year to $493 million.
We are pleased that the ‘digitisation’ initiative has paid off with improvements in volumes and significantly, more positive feedback from retail partners and end-consumers. Going forward, with Ms James onboarding as CEO, we expect continued improvements here given her extensive experience in commercialising new digital solutions.
Finally, we take a look at the Consumer Leasing business (AUS/Ireland) which has been the hardest hit by management’s decision to “retire” the older FlexiRent brand. Unsurprisingly, revenues here were down a substantial 18% year-on-year to $51.8 million and with a significantly lower (-93%yoy) Cash NPAT of $400,000 due to the large write-off.
On the flipside, the decision to retire the old brand and replace it with Lisa and Smartpay was prudent with a surge in the company’s Net Promoter Score (NPS) – an index that gauges customer satisfaction & loyalty while linked to revenue growth – from near zero or negative levels to over 30 points.
Note that anything above 20 is considered “favourable” while over 50 is excellent, and above 80 is world class. Considering that these brands are new achieving an NPS of over 30 with only 5 months on record is an impressive result and we will continue to monitor this metric going forward.
The new brands, under stricter regulation and increased management focus, have also benefitted with substantially better credit quality. According to management, impairment losses have fallen 28% year-on-year to $7.6 million.
Overall, we are pleased with the FY18 performance with the company manoeuvring headwinds while showing growth in key operational metrics despite closing out an older brand. The company’s Cash NPAT hit the upper end of the guidance ($85-$90mln) at $88.2 million.

Source: 21 August 2018 Company Presentation
Statutory NPAT, on the other hand, tells a different story with a $10.3 million loss mainly due to the $89.1 million goodwill (non-cash) write-down of the FlexiRent brand. Though we are more interested in looking towards the future with the company successfully transitioning out of the legacy brands and solutions towards offerings suited to a younger customer base.
Management are also positive on the outlook for FY19 with an expectation of Cash NPAT to grow between 8% and 13% as shown in the graphic below:

Source: 21 August 2018 Company Presentation
This growth will likely be achieved via a consolidation of operations (lower overhead) while ramping up the growing and lucrative Certegy and Australia Cards businesses. The Ireland businesses are also likely to contribute to the bottom-line in FY19 as investment spend winds down while volumes and scale picks up.
Turning to the charts, on the daily, the technical picture remains challenged with prices falling below dynamic support at the 200-day (green line) and 50 day (red line) moving averages. Resistance at the 50% Fibonacci retracement at $1.89 has held firm, and a move above here is needed to improve the outlook.

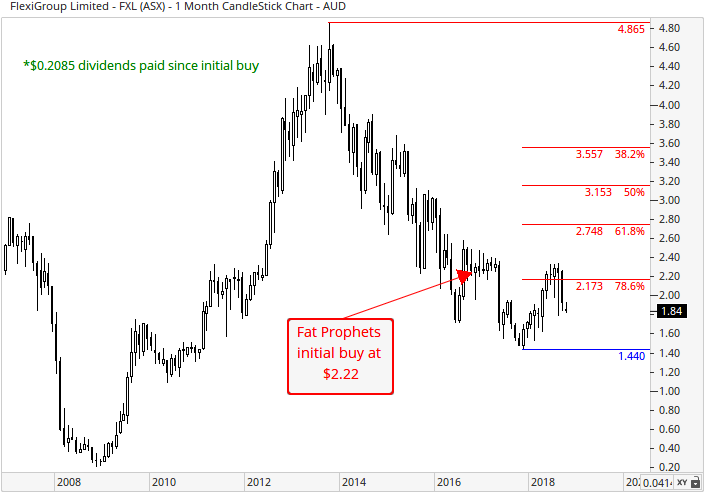
With reference to the monthly chart, near term support is sighted at the November low of $1.44 (horizontal thin-blue line), followed by an additional layer between $1.08 and $1.20 should the bears maintain downward pressure. In order for the short-term outlook to improve, a sustained break above overhead resistance evident at the 78.6% Fibonacci retracement of $2.17 is required. Should this favourable scenario occur, then short-term momentum would be confirmed to have shifted upwards. However, it should be noted that the dominant long-term downtrend remains in play, and therefore, the climb north could be slow in coming.
Summary
Overall, FY18 was a solid year for FlexiGroup (ASX:FXL) which reported marked improvements across key metrics, supported by the prudent retirement of legacy brands (instead of pointlessly holding on) and replacing them with more ‘relevant’ brands. While the shares have yet to perform, we remain encouraged by the company’s outlook under new leadership.
From a valuation perspective, the shares are very modestly priced in our view, at around 7.1 times FY20 earnings, with a prospective dividend yield of 4.9 %.
However, given that the business has just undergone a costly restructuring and is onboarding new leadership, we are adopting a ‘wait and see’ approach for now. FlexiGroup (ASX:FXL) will remain held in the Fat Prophets Portfolio.
Disclosure: FlexiGroup (ASX:FXL) is held in the Fat Prophets Small & Mid-Cap managed account portfolio.

