
On the Queensland Team
Suncorp Group (ASX:SUN) shares have made modest gains since our last coverage. We continue to be positive on the name due to the combination of a reasonable valuation and our expectation of an improving premium and investment income environment. The company has a good banking business and strong positioning in the Queensland market, an area which we view favourably and whose prospects have improved recently on stable commodity prices.
March Quarter Update – Suncorp Bank (ASX:SUN)
During the March quarter lending growth moderated for Suncorp Group’s bank, with total lending increasing by $546 million or 0.9%, leading to financial year-to-date growth of 5.4%. The home lending portfolio expanded $361 million or 0.8% as stiff price competition acted as a headwind to growth. Suncorp is targeting relatively conservative market segments, a view we think prudent given the Australian housing market environment. This includes lending to first home owners and seeking to diversify its geographic base through broker partnerships.
The bank’s lending portfolio has historically been concentrated in Queensland, and this is gradually shifting via growth in other areas. Outside of Queensland, the next largest exposure is in New South Wales and then Victoria. At the end of March 2018, some $27.755 billion of total loans of $58.305 billion were outside of Queensland.

Source: Suncorp (ASX:SUN) APS 330 disclosure
Interest-only lending reduced to 17% of originations over the quarter, a trend we are seeing industry wide. Suncorp has lower than average levels of bother investors and interest-only lending. Investor loans represent 29% of the mortgage portfolio and interest-only loans 21%, most of which is for investment, not owner-occupied purposes.
Lending to higher risk segments such as inner-city apartment developments is being closely monitored and restricted in scope. The company grew business lending 1.7% from the end of March, primarily within the commercial and small business portfolios. The Agribusiness portfolio (+1.0%) returned to growth near the end of the quarter.
Overall credit quality was again good, with impairment losses of just $2 million or 1 basis point of gross loans and advances (annualised). That was an unusually low level in the quarter, but management expect for the full year that it will remain towards the bottom end of the through the cycle operating range of 10 to 20 basis points. Gross impaired assets totalled $140 million and were effectively stable with a quarter ago and down over the past year. Past due loans increased $42 million to $453 million, which was driven by an expected seasonal increase in retail arrears and two mid-to-large commercial banking customers moving to past due. Both commercial loans were acquired prior to 2014.
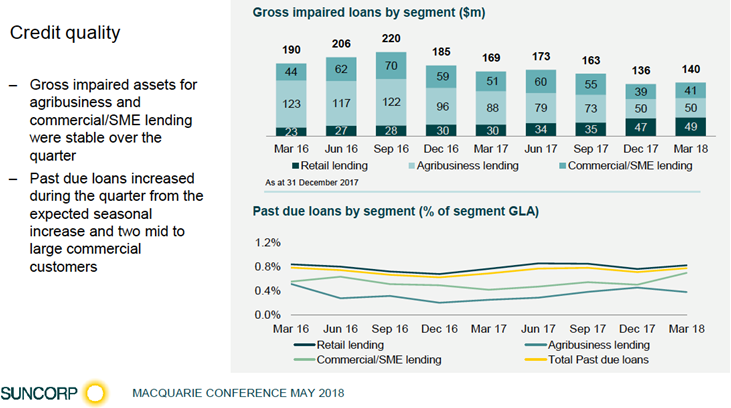
Source: Suncorp (ASX:SUN) May 2018 presentation
Credit quality has improved from historical levels, especially in the agribusiness and commercial lending portfolios. Over the quarter, gross impaired assets for both agribusiness and commercial lending were stable, but material reductions from 12-18 months ago.
Recent widespread rainfall in many parts of Queensland and New South Wales is positive for winter crops and beef cattle, providing a good backdrop for the June and September quarters. A relative improvement in commodity prices and the ongoing low interest rate environment leads management to believe bad and doubtful debt expenses will remain benign for now. Like other Australian banks, funding costs have been pushed up by increases in the BBSW rates driven by both domestic and international factors. Accordingly, the Net Interest Margin for the financial year was anticipated to be around the midpoint of the target range of 1.80% to 1.90%.
Financial strength is adequate for a bank of its size. After payment of the 2018 interim dividend to Suncorp Group, the common equity tier 1 (CET1) ratio was 8.8%, just above the midpoint of the targeted range of 8.5% to 9.0%.
At the Macquarie conference presentation in May, the bank also provided some FY19 targets for Suncorp Group. These included group top line growth of 3% to 5% and a general insurance underlying ITR of at least 12%. These and some others are provided below:

Source: Suncorp (ASX:SUN) May 2018 presentation
Suncorp Group’s FY18 results are not due out until next month, but to briefly recap, the group’s interim numbers and net profit after tax (NPAT) fell 15.8% year-on-year to $452 million in the six months ended 31 December 2017. Even as the company posted top line growth of 2.5%, driven by decent momentum in Consumer General Insurance and Banking. The $452 million in profit fell a little short of the consensus estimate.
Cash earnings of $472 million slumped 19.2% from a year earlier. The combined Australia and New Zealand General Insurance underlying trading insurance trading ratio came in at 10.2%, adjusted for Business Improvement Program (BIP) costs.
A hit from the hailstorm in Melbourne (estimated at $167 million at the time of the results) and a rise in costs crimped profit, but management remained upbeat on the prospects of delivering on cost benefits from investing next year. Natural hazard costs of $395 million were $65 million above allowance.
Total operating expenses increased by a more modest 3.3% adjusted for the BIP. Suncorp is forecasting the BIP to deliver net benefits of $10 million, $195 million and $329 million in FY18, FY19 and FY20 respectively. Suncorp CEO Michael Cameron stated, “With a gross benefit run rate of $124 million already locked in, we are well positioned to achieve our net targets.”
Suncorp (ASX:SUN) maintained its dividend at 33 cents per share, which equated to a 90.1% pay-out ratio. That was well above the historical range and above the top end of the 60% to 80% targeted pay-out range.

Source: Suncorp (ASX:SUN) May 2018 presentation
After accounting for the dividend, Suncorp said the excess capital position was $381 million. The Bank’s Common Equity Tier 1 (CET1) ratio of 9.01% was at the top end of the target operating range of 8.5% to 9.0%. As stated above, at the end of March that had come down after paying a dividend to Suncorp Group. The General Insurance CET1 position of 1.22 times the PCA (Prescribed Capital Amount) was also at the top end of its target range (1.0 – 1.2 times).
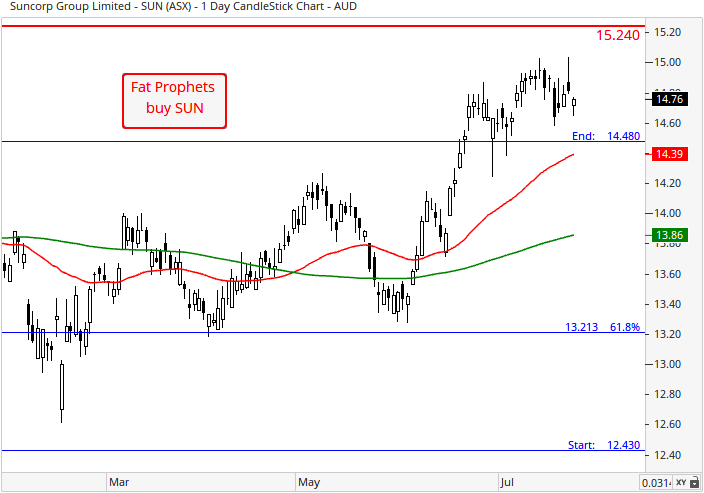
Turning to the charts, and the technical picture on Suncorp has improved significantly since our last review and buy recommendation in March. A bullish crossover is now in play as of May where the 50-day moving average (red line) crosses above the 200-day moving average (green line). As we suggested, a broader bullish rotation has evolved, with a sustained break above the $13.80 region coming to fruition, with the medium-term upward momentum shifting north. The successful retest of the December 2017 high of $14.48 has also unfolded. Next port of call is resistance at $15.24, the July 2017 high.
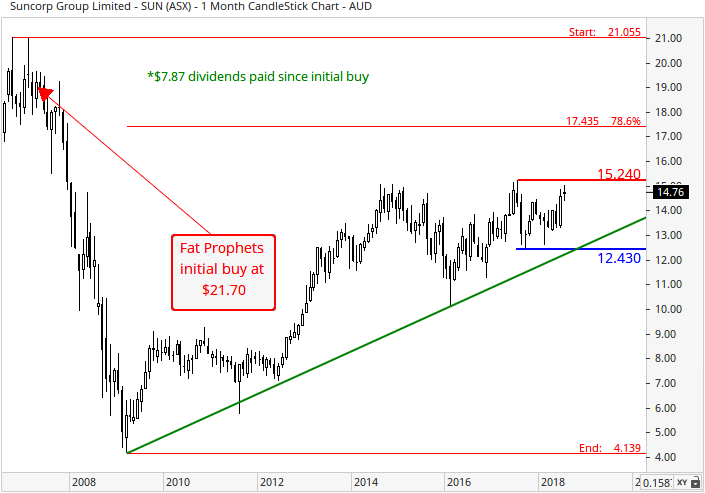
Regarding the monthly chart, prices have continued to climb back up the upward sloping trend line, after a previous corrective phase. For the long-term uptrend to resume its upward trajectory, a decisive clearance of resistance located between $14.59 and $15.24 is required. This is made up of the 61.8% Fibonacci retracement and the aforementioned July 2017 high (horizontal solid-red line) respectively. In the grand scheme of things, the series of higher lows and higher highs are characteristics of a dominant broader-term uptrend in play, and thus would likely steer the prevailing direction of Suncorp.
Summary
Looking ahead, we remain constructive on Suncorp’s medium to longer-term growth prospects, especially on the back of rising yields (in Australia as well as globally) over the medium-to-long term and management’s efforts to keep costs contained. The new customer-focussed model from the diversified financial services player should deliver benefits to shareholders from cross-selling and increased “wallet share,” although it remains to be seen if the return on investment generated will be adequate.
Although there has been no announcement regarding the sale of the life insurance business, if a reasonable price can be obtained, we would view such as transaction positively.
Suncorp (ASX:SUN) shares are trading on approximately 18 times FY18 earnings with a dividend yield of 4.9%.
Accordingly, Suncorp Group (ASX:SUN) will remain held in the Fat Prophets Portfolio. We recommend the shares as a buy for Members without exposure, and who are also prepared to take a medium to longer term view.
Disclosure: Suncorp (ASX:SUN) is held in the Australian Share Income Model.

