
Fat Prophets take Profits
Despite a solid first half result that delivered a ‘clean’ 6% year-on-year increase in cash earnings and a relative legal victory (albeit not a moral one) regarding the bank bill swap rate (BBSW) case, Westpac (ASX:WBC) shares have entered a downward trend over the past six months. With the interim results setting a relatively high hurdle for Westpac to leap over given some headwinds, we view it as an appropriate time to take profits on the position.
Westpac management have indicated revenue growth will be more challenging going forward and highlighted a relative tightening of funding markets, as well as higher costs associated with the increase in regulatory scrutiny. There are also some concerns regarding the composition of its mortgage book weighing on sentiment. Meanwhile, the technical picture has deteriorated. Accordingly, we have a relative preference for other banks such as ANZ, NAB and Bank of Queensland due to case specific factors.
Westpac (ASX:WBC) has been a solid performer in the portfolio, with strong dividends flowing since its inclusion. Having taken profits on the stock a couple of times (FAT-AUS-695, FAT-AUS-651), and having maintained a hold recommendation for several years, we now believe it is time to move on.
We recommend Members sell Westpac around current prices. The stock will be removed from the Fat Prophets portfolio at this juncture.
1H18 Headline Numbers
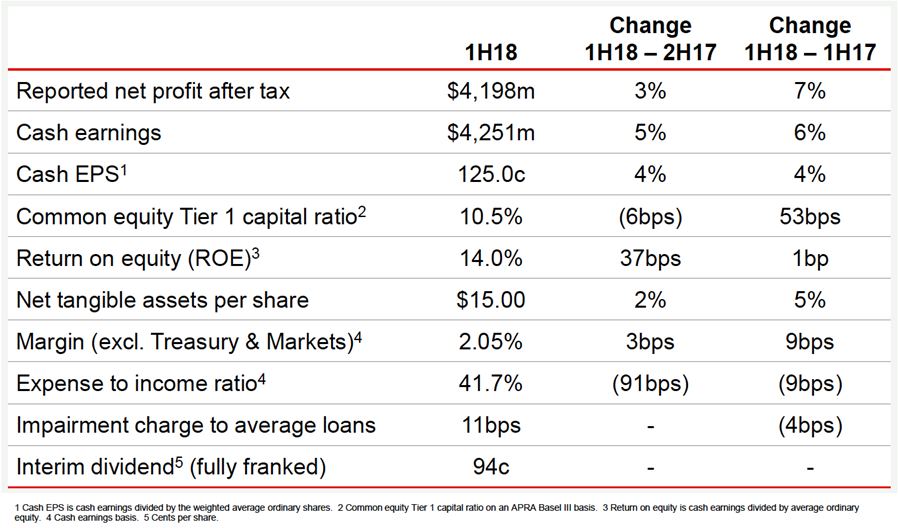
For the six months ending 31 March 2018 (1H18), Westpac reported statutory net profit of $4,198 million, representing an increase of 7% compared to 1H17. Cash earnings – which are the more closely watched profit metric for Westpac and its peers – increased 6% to $4,251 million, to come in slightly above expectations.
Cash earnings per share of 125.0 cents marked a lower 4% increase following new share issuance as part of the DRP (dividend reinvestment program). The interim dividend was left unchanged at 94.0 cents a share, disappointing the market. That represented a pay-out ratio of 75.28%, down from 78.57% a year earlier and was the lowest for a couple of years.
The group cash return on equity (ROE) of 14.0% was little changed with a year ago (+1 basis point) and up 37 basis points from the September half.
Source: Westpac (ASX:WBC)
Group cash earnings were underpinned by strong double-digit percentage cash earnings growth in the Consumer Bank and Business Bank divisions. The Institutional Bank was a laggard, with a double-digit percentage decline in cash earnings, but is a smaller contributor to the group than the Consumer or Business Bank.
Group core earnings grew 4% to $6,497 million, while impairment charges were approximately 20% lower at $393 million, bolstering profit. Driving core earnings, net interest income grew 8%, while non-interest income declined 7%. Overall, net operating income increased 4% to $11,151 million. Net operating expenses were well contained, rising just 3%.
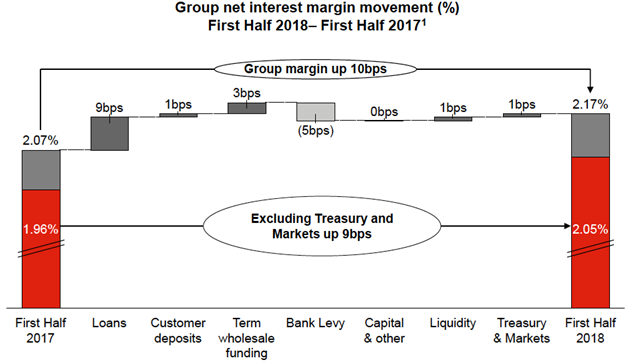
The 8% increase in net interest income to $8,301 million was driven by 4% growth in average interest-earning loans, propelled by growth in housing, a 9-basis point increase in the group net interest margin (NIM) excluding Treasury and Markets. Including Treasury and Markets the group NIM increased 10 basis points to 2.17%, despite a 5-basis point drag from the Bank Levy.
Source: Westpac (ASX:WBC)
Lending growth was led by Australian mortgages (the largest contributor) growing 6%, while Australian business lending was up 3%. New Zealand lending increased 3% in NZ dollar terms, which translated to 6% growth in Australian dollars. Group customer deposits increased 5% year-on-year.
Non-interest income was down $218 million, or 7% from 1H17 to $2,850 million with the decline mostly due to lower markets related income and a decrease in banking fee income, with the latter due to “lower credit card interchange fees, the elimination of certain ATM fees and capping account-keeping fees”.
Net operating expenses increased 3% to $4,654 million, with the increase mainly due to an increase in investment-related spending and higher regulatory and compliance costs, including those related to the Royal Commission.
Impairment charges of $393 million were $100 million, or 20% lower year-on-year reflecting sound overall credit quality. They did tick up $33 million or 9% from the September 2017 half year though.
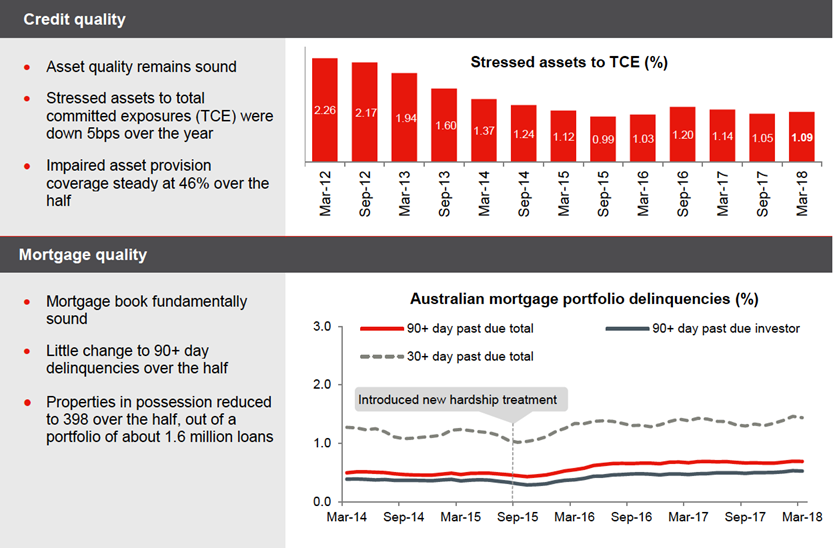
Stressed assets to total committed exposures (TCE) edged up 4 basis points from the September half to 1.09% in 1H18, but were down 5 basis points from a year earlier as the backdrop for the New Zealand dairy portfolio improved. There was little change in the quality of the key mortgage loan portfolio on the books, although there was slight uptick in loans 90 days past due.
The mortgage book at Westpac has faced some heightened scrutiny after Royal Commission hearings and a review – based on a PwC report – that found Westpac to have relatively exposure to high loan-to-value (LVR) and interest-only (IO) loans.
Source: Westpac (ASX:WBC)
Turning briefly to a few of the key divisional results and the Consumer Bank posted 1H18 cash earnings of $1,717 million, up 12% year-on-year. This was driven by balance sheet growth, an increase in the net interest margin and lower impairment charges. Total net loans increased 5% to $378 billion, driven by a 6% increase in mortgages, while total deposits also increased 5% to $199.4 billion.
The net interest margin (NIM) increased 10 basis points year-on-year to 2.37%, while impairment charges of $233 million were 14% lower than a year earlier. Positively, the expense to income ratio showed a one percentage point improvement year-on-year to 39.17%.
The Business Bank posted 13% growth in cash earnings to $1,080 million, driven by an increase in loans and good margin discipline, along with a decrease in impairment charges. Core earnings grew 7% from a year ago as total net loans increased 4% to $151.7 billion and the net interest margin expanded 8 basis points to 2.78%. Impairment charges fell by roughly a third (-32%) to $137 million.
Westpac Institutional Bank was the weak link when compared to a year earlier, with cash earnings slipping 12% to $551 million, largely because a strong markets performance in 1H17 was not repeated in 1H18. Non-interest income slumped 22%, while net interest income edged up 3%. A net impairment benefit a year earlier swung to a modest impairment charge in 1H18.
Westpac has said it remains committed to owning its wealth management business, BT Financial Group. Its cash earnings increased 7% year-on-year to $404 million, as revenue increased 5% and operating expense growth was contained to 2%. Management said the sale of its stake in BT Investment Management had removed some of the conflicts of interest that had concerned some.
On the capital side, Westpac’s CET1 (common equity tier 1) ratio stood at 10.50% at March 2018, in line with APRA’s ‘unquestionably strong’ benchmark ahead of the January 2020 deadline. The CET1 ratio was down 6 basis points from the 10.56% at 30 September 2017, as regulatory modelling changes reducing the ratio 22 basis points were partially offset by first half organic capital generation of 19 basis points. The following ‘waterfall’ chart shows the key factors bridging the two periods.

Source: Westpac (ASX:WBC)
Turning to the charts, and on the daily, prices have broken below both the 50 (red line) and 200 (green line) moving averages which confirms momentum has rotated south. Support at the 78.6% Fibonacci retracement of $30.31 has given way, as has that at $29.40, being the May 2017 low. Prices are now flirting with support at $28.24 which could open the door to an even steeper decline.

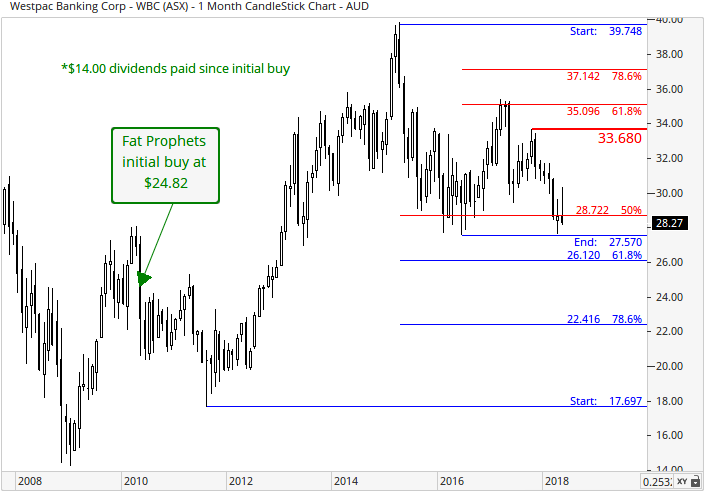
With reference to the monthly chart, resistance was respected at the 61.8% Fibonacci retracement (red set) of $35.10 in May last year. This has resulted in a rotational shift in downward momentum. Support at the 50% Fibonacci retracement of $28.72 has given way, and the next layers in sight are at $27.57, and $26.12 (61.8% Fibonacci retracement). If these do not hold this is likely a precursor to an even deeper turn south.
Summary
Westpac shares are currently trading on approximately 11.4x forecast FY18 earnings and 11.3x FY19, while the projected yield over the same time frame expands from 6.7% to 6.8%.
Despite a solid first half result that delivered a ‘clean’ 6% year-on-year increase in cash earnings and a relative legal victory (albeit not a moral one) regarding the bank bill swap rate (BBSW) case, Westpac (ASX:WBC) shares have entered a downward trend over the past six months. With the interim results setting a relatively high hurdle for Westpac to leap over given some headwinds, we view it as an appropriate time to take profits on the position.
Westpac management have indicated revenue growth will be more challenging going forward and highlighted a relative tightening of funding markets, as well as higher costs associated with the increase in regulatory scrutiny. There are also some concerns regarding the composition of its mortgage book weighing on sentiment. Meanwhile, the technical picture has deteriorated.
Westpac (ASX:WBC) has been a solid performer in the portfolio, with strong dividends flows since its inclusion. Having taken profits on the stock a couple of times (FAT-AUS-695. FAT-AUS-651), and having maintained a hold recommendation for several years, we now believe it is time to move on.
We recommend Members sell Westpac (ASX:WBC)c around current prices. The stock will be removed from the Fat Prophets portfolio at this juncture.
Disclosure: Westpac (ASX:WBC) is held in the Fat Prophets Australian Share Income managed account portfolio.

